← Back to work
SaaS · GHG Accounting · Sustainability
Turning GHG data collection from a spreadsheet chase into one dashboard an organisation can act on.
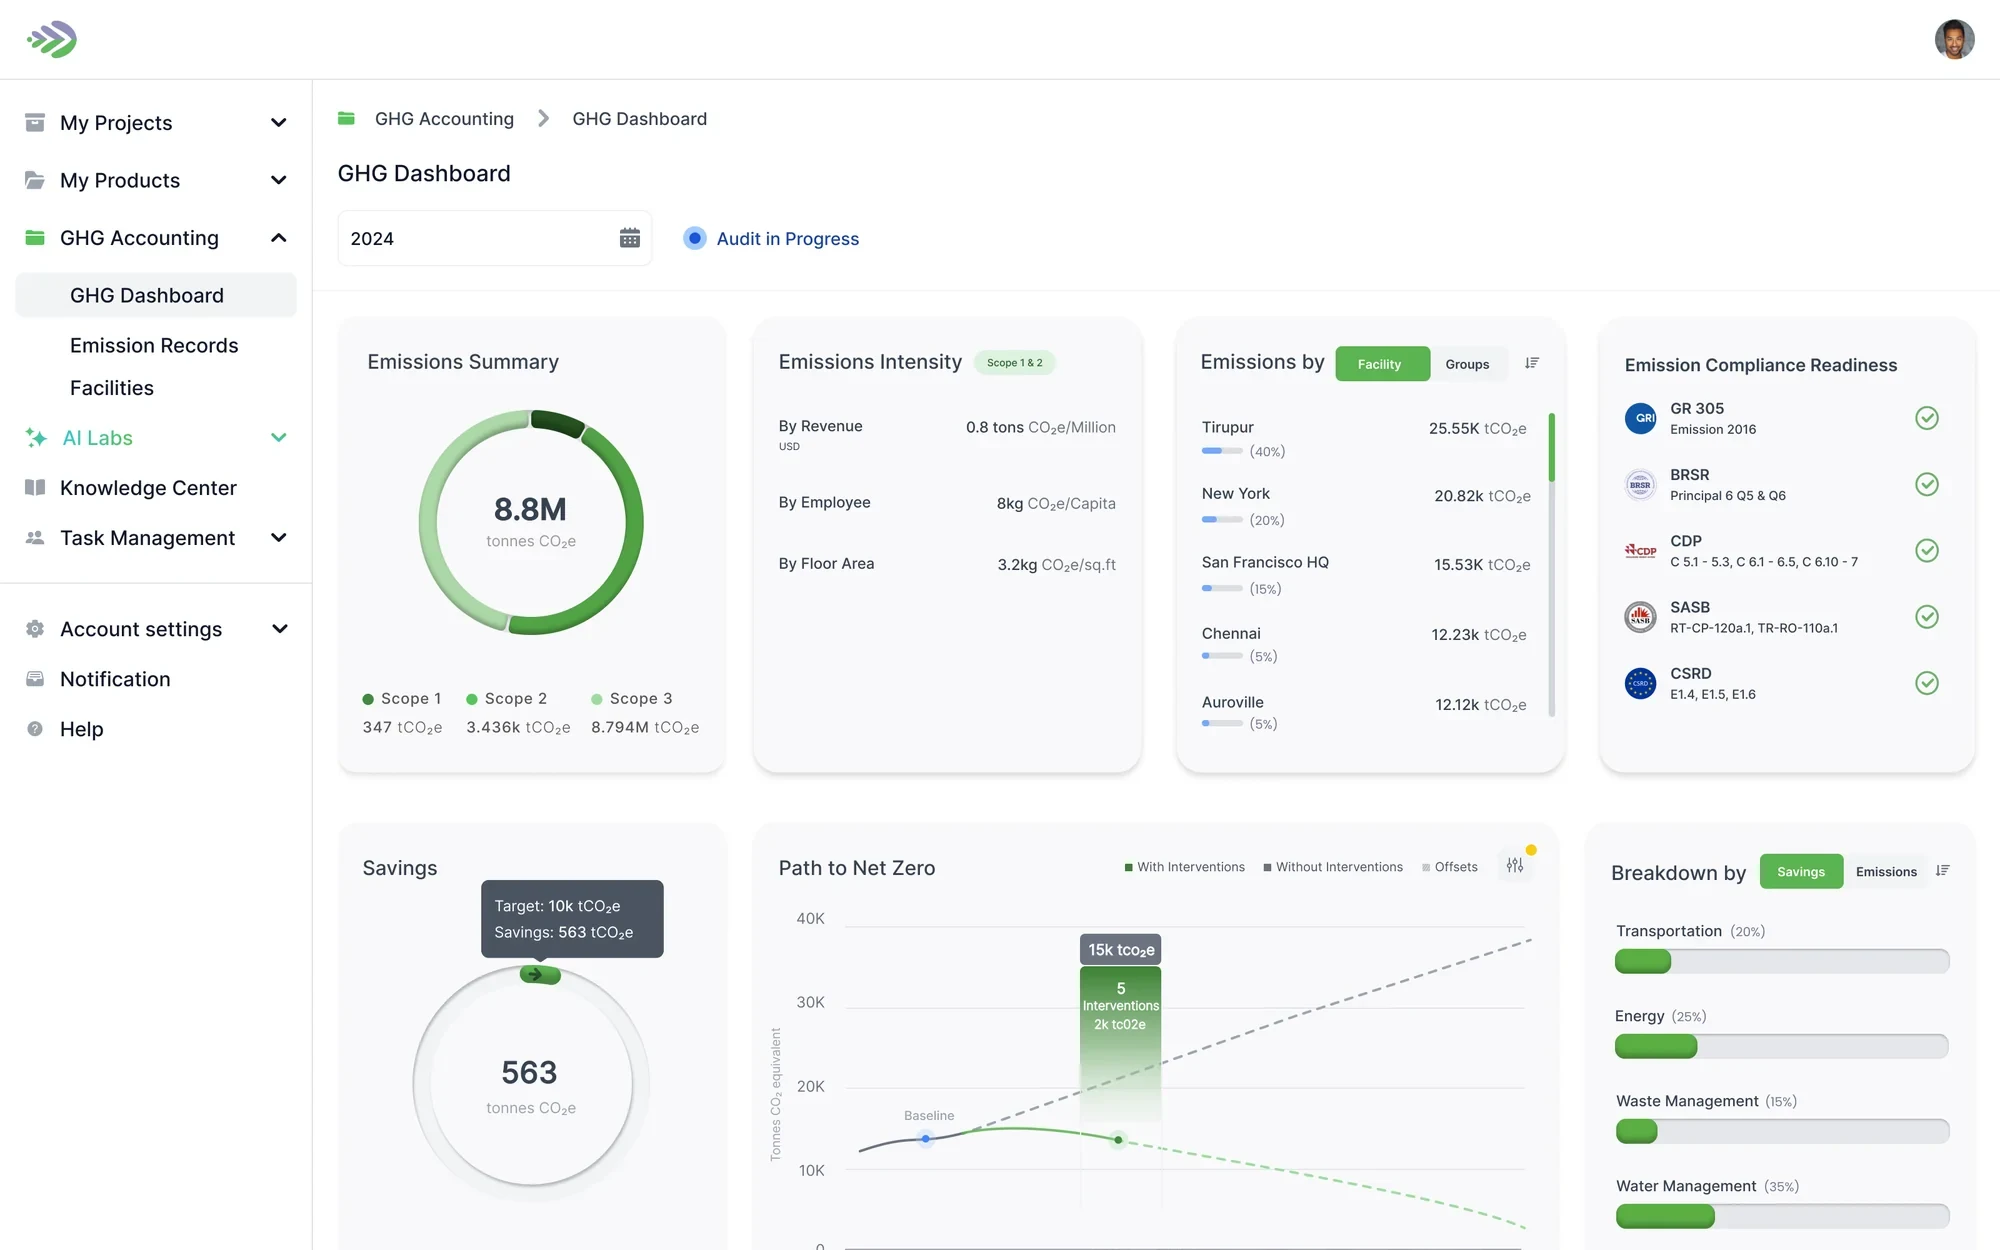
The part of Bevolve's sustainability platform where a company collects data from its facilities, calculates the greenhouse gas emissions they produce, and sees the result in one dashboard: emissions by facility and overall, savings against target, compliance readiness, and the path to net zero.
To measure its footprint, a company has to gather activity data from every facility, calculate the emissions each one produces, and then roll everything up to an organisation-level view. Before this module, that process was complex, manual, and hard to keep on top of.
I designed data collection screens that make providing facility data straightforward, including drag-and-drop uploads that Bevolve AI reads, with emissions calculated for you and brought together in a single GHG dashboard.
Emissions by facility and overall, savings against target, compliance readiness, and the path to net zero, all in one dashboard view.
Bevolve's clients report their greenhouse gas emissions to frameworks such as GRI 305, BRSR, CDP, SASB and CSRD. The raw data sits with the people running each facility, in fuel bills, electricity invoices, travel claims and spreadsheets. Before this module, getting it into one inventory was manual, slow and hard to keep on top of.
The brief was to let a company collect that data on the platform, have the emissions calculated for them, and see where they stand in one place. I led the design for the data collection flow and the GHG dashboard, with 3 designers and 6 developers, over 18 months.
I ran stakeholder sessions with Bevolve's sustainability consultants and product team, who work with client companies every day, to map how clients collected their data before the platform. Most of it travelled as email attachments and shared spreadsheets, and someone retyped every value.
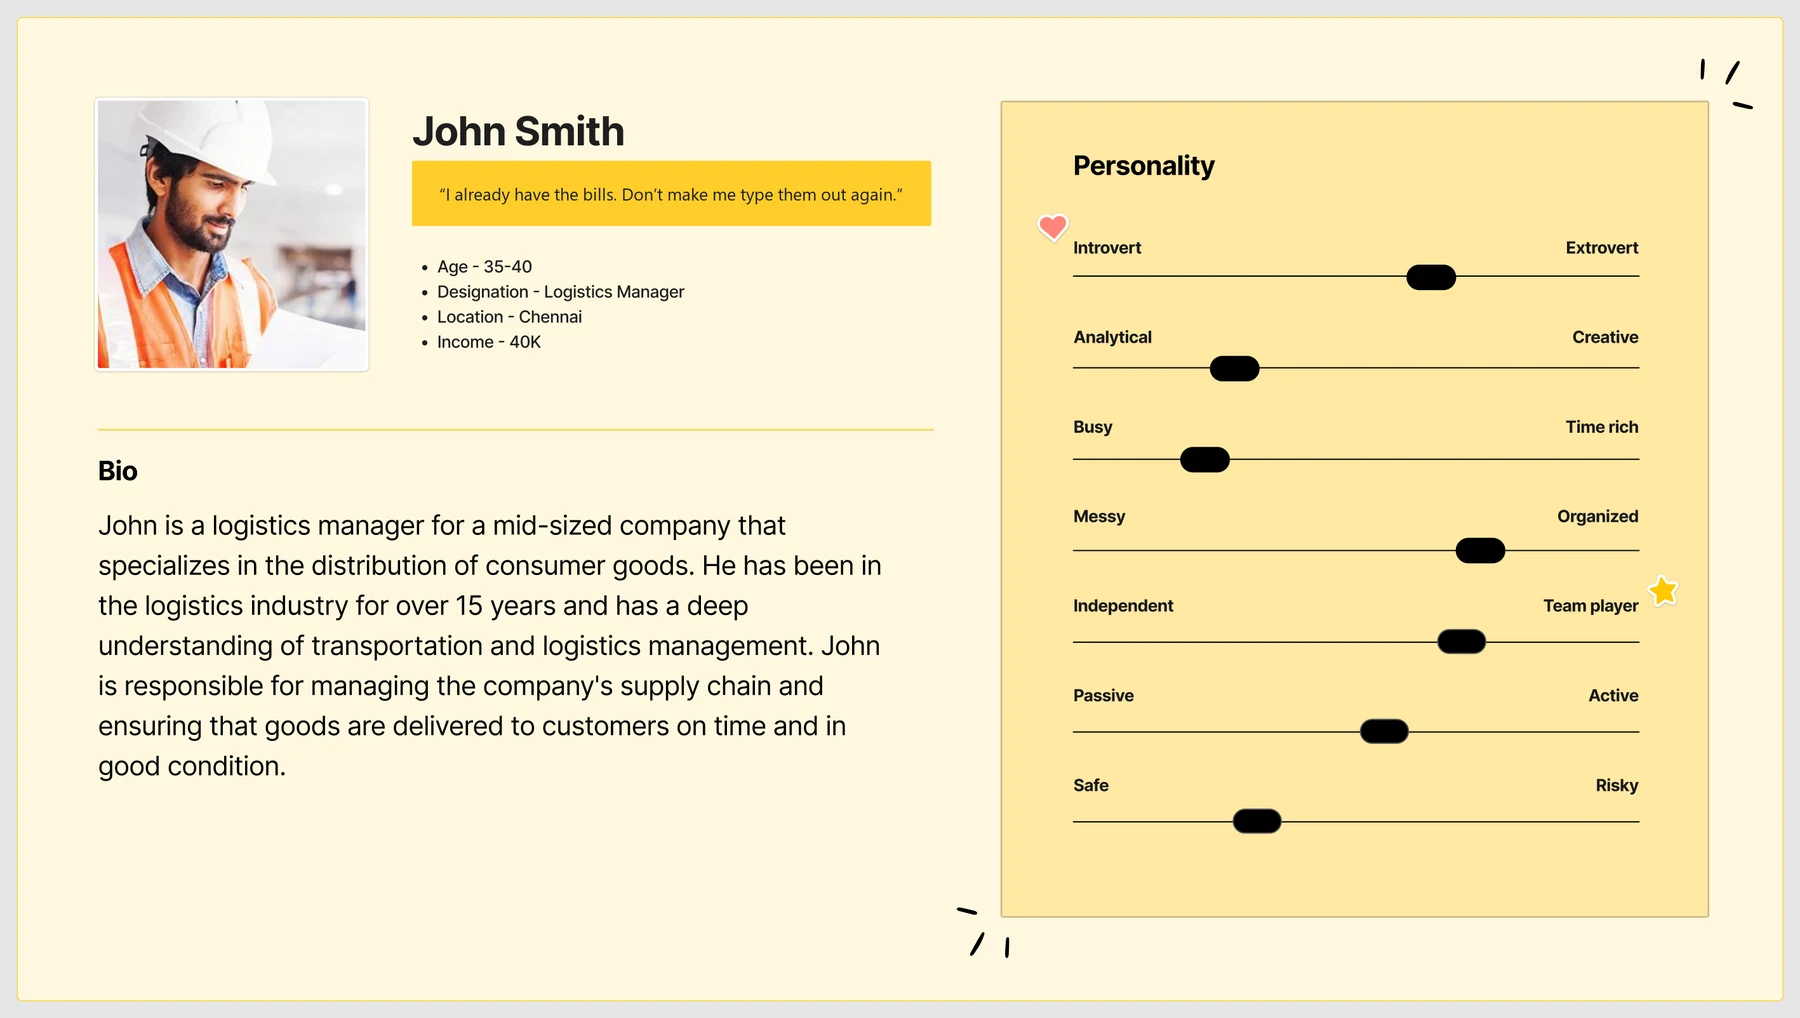
Facility teams already had bills, invoices and spreadsheets. Retyping each value into a form was where most of the delay and the errors came from.
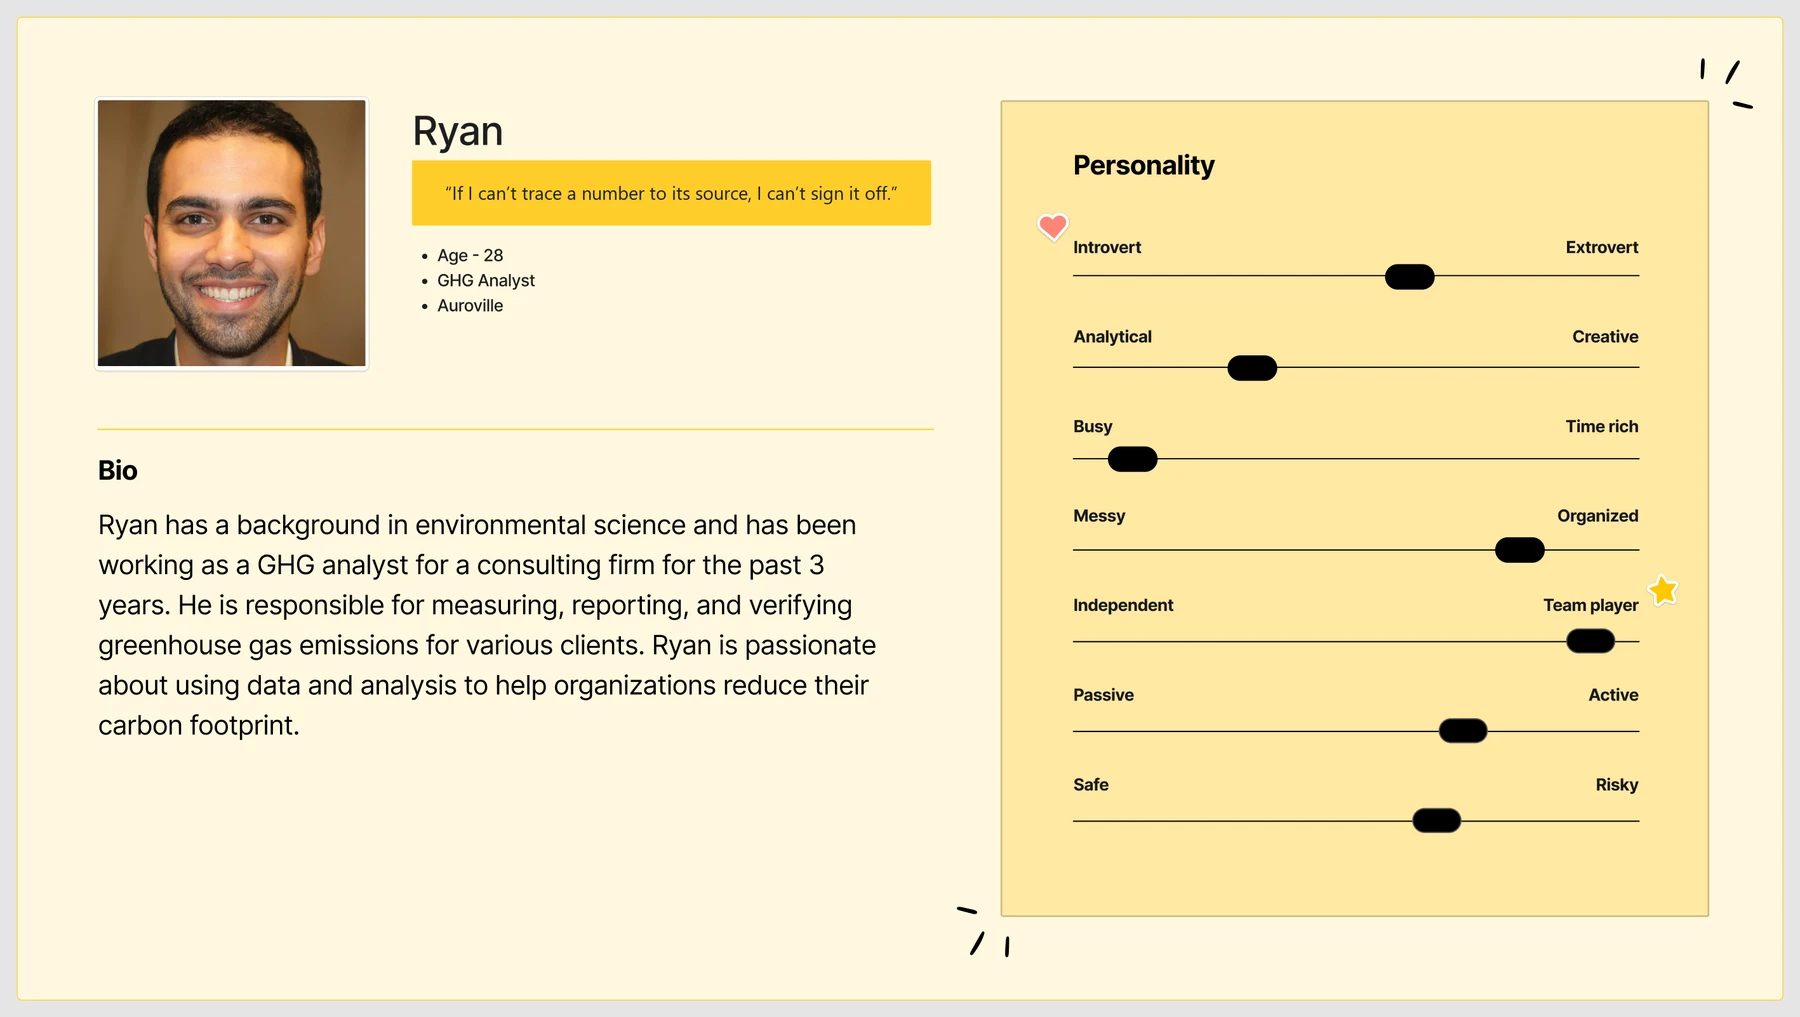
Analysts and their assurance partners need to know where every value came from and who approved it, before it goes into a report.
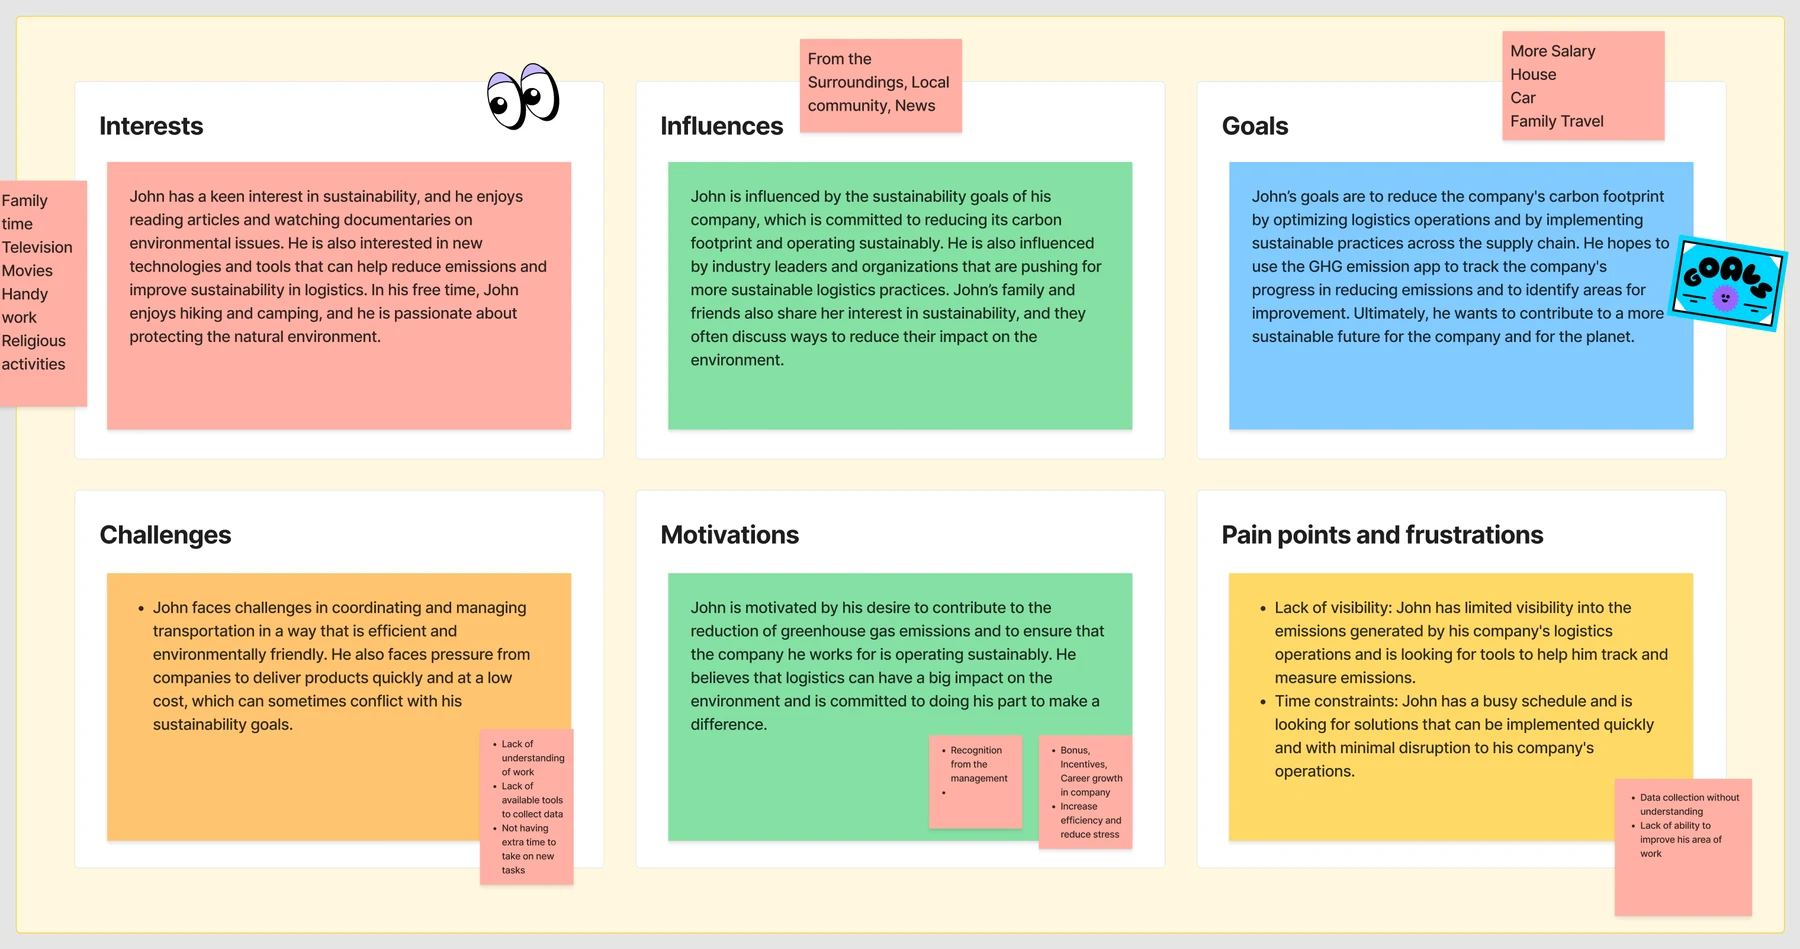
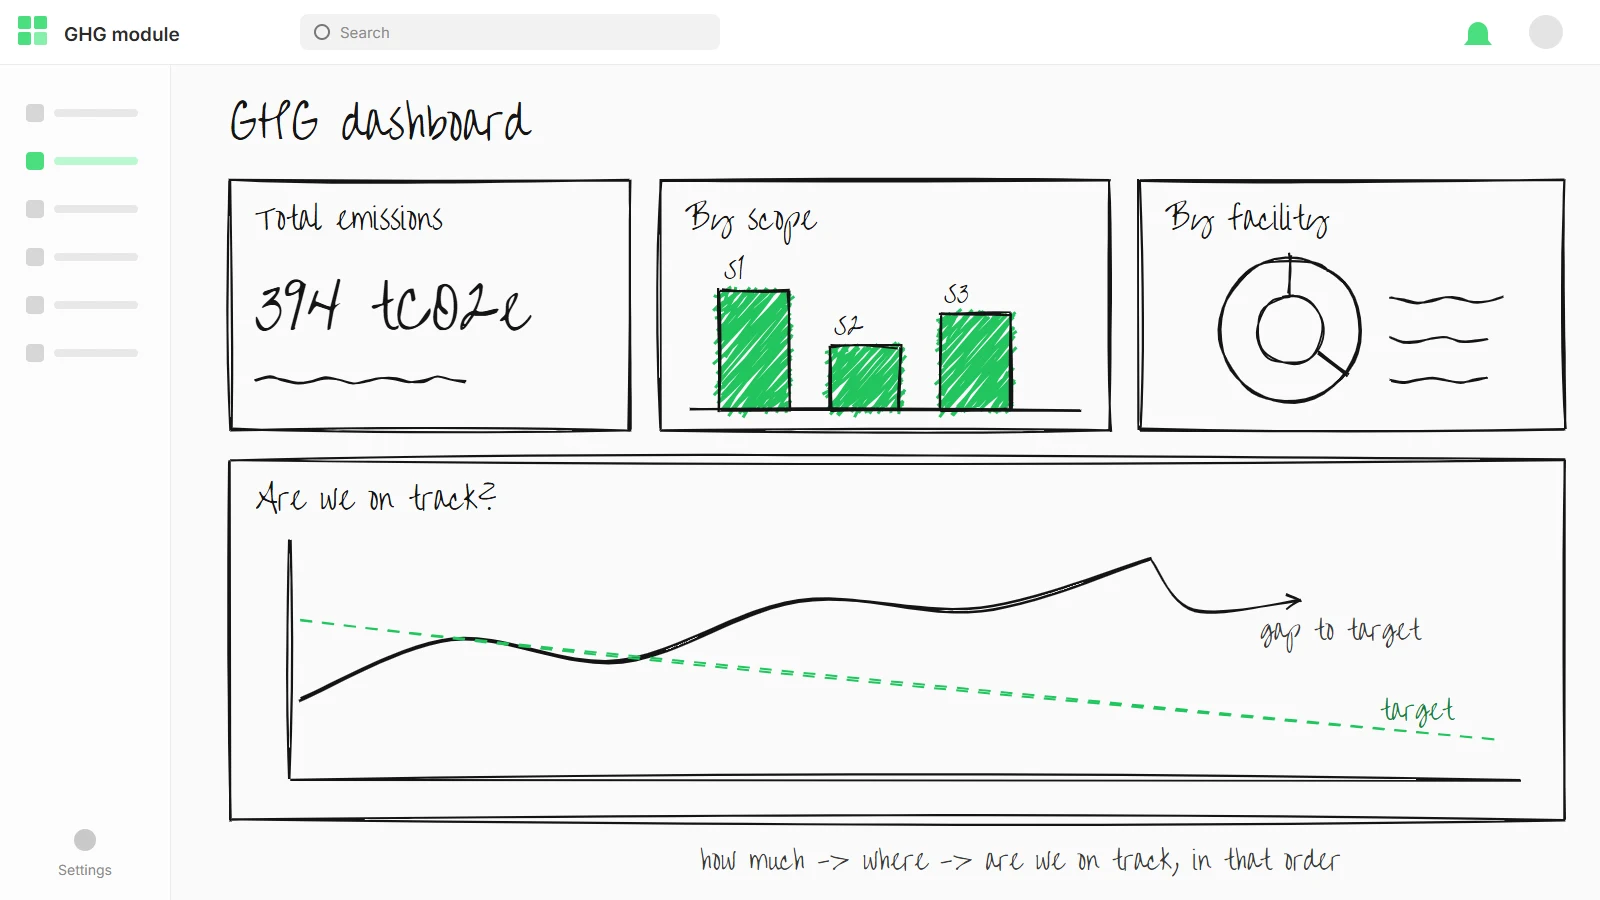
How much are we emitting, where, are we compliant, and are we on track. The dashboard had to answer them in that order.
I turned what we learned from the consultants into three personas in FigJam. The operational user hands the data over, the analyst checks and reports it, and management acts on the result. Every screen in the module was reviewed against them.
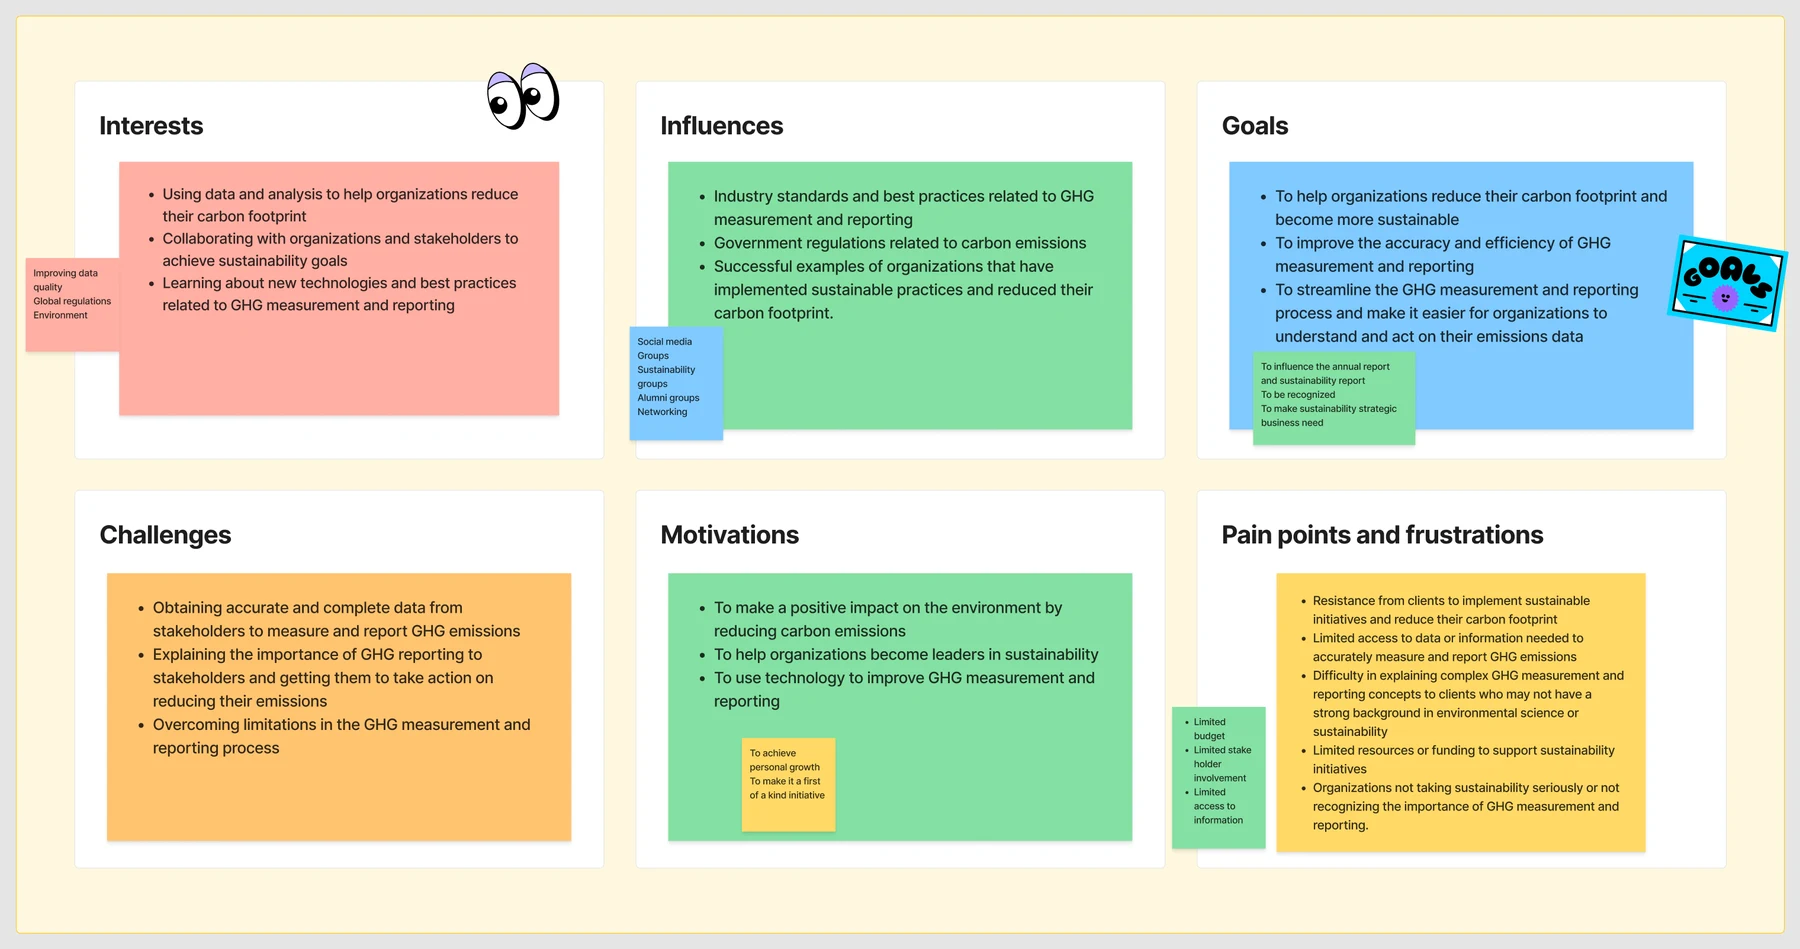
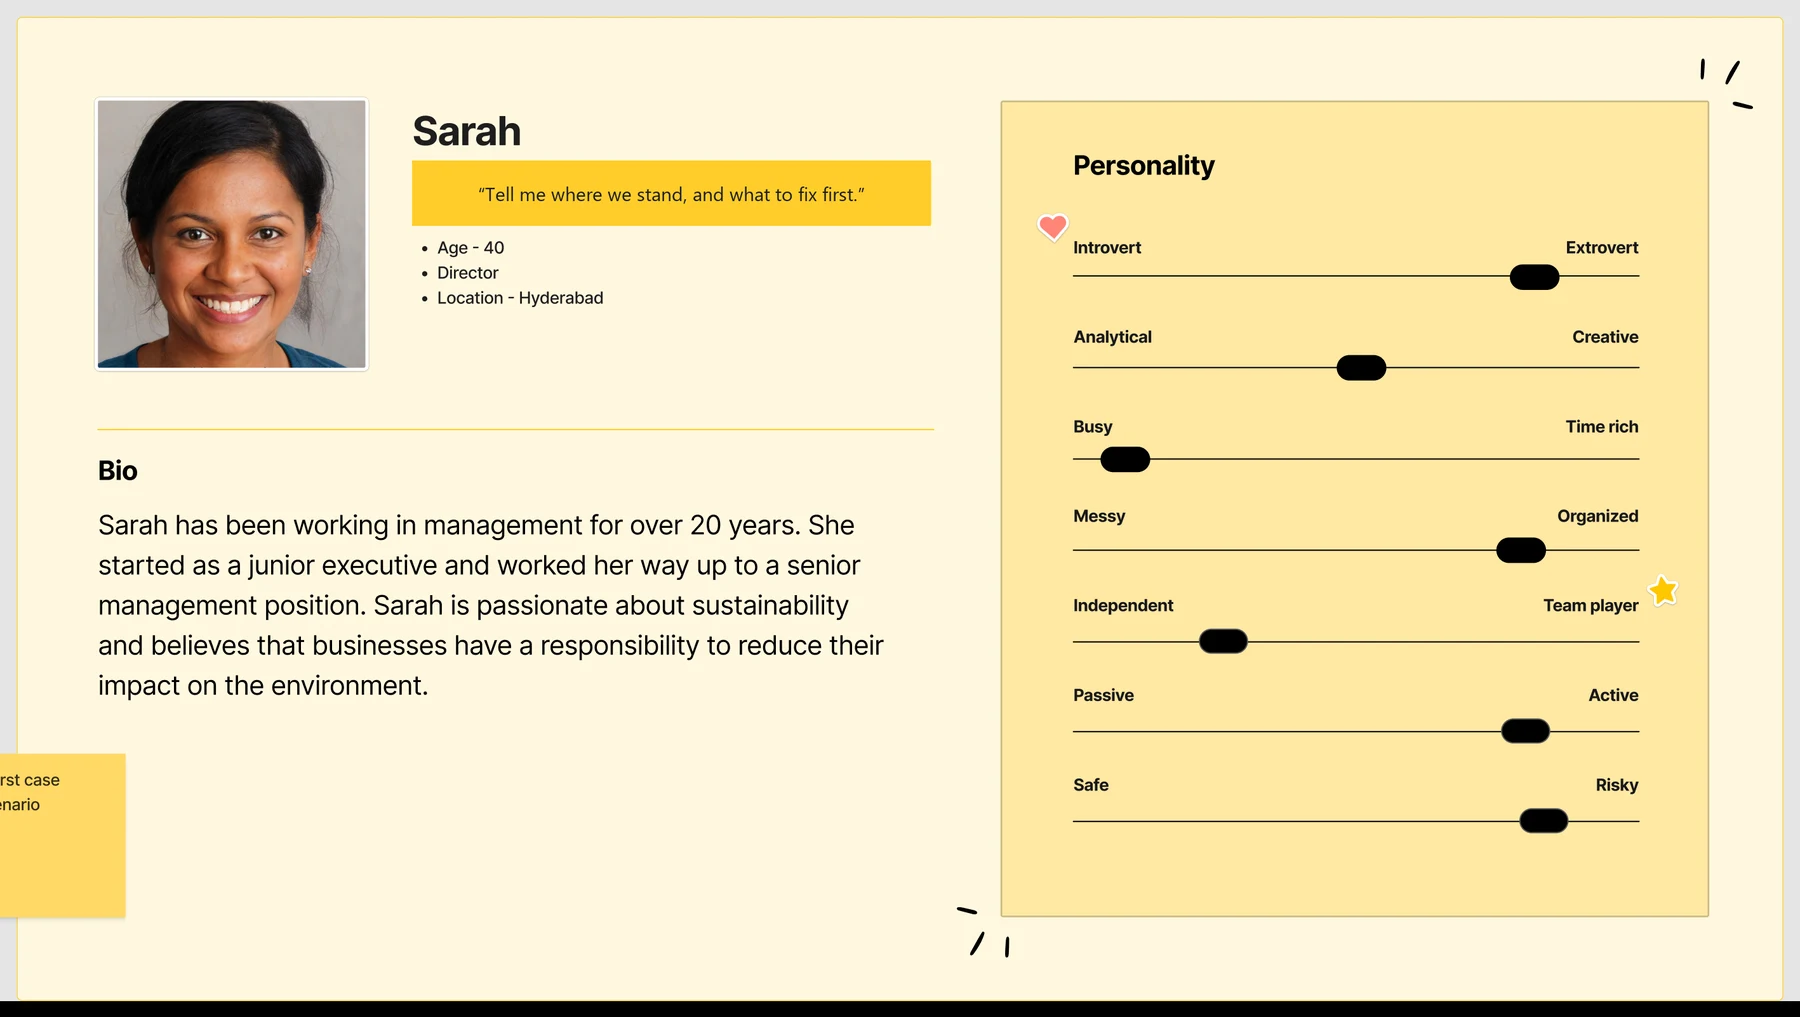
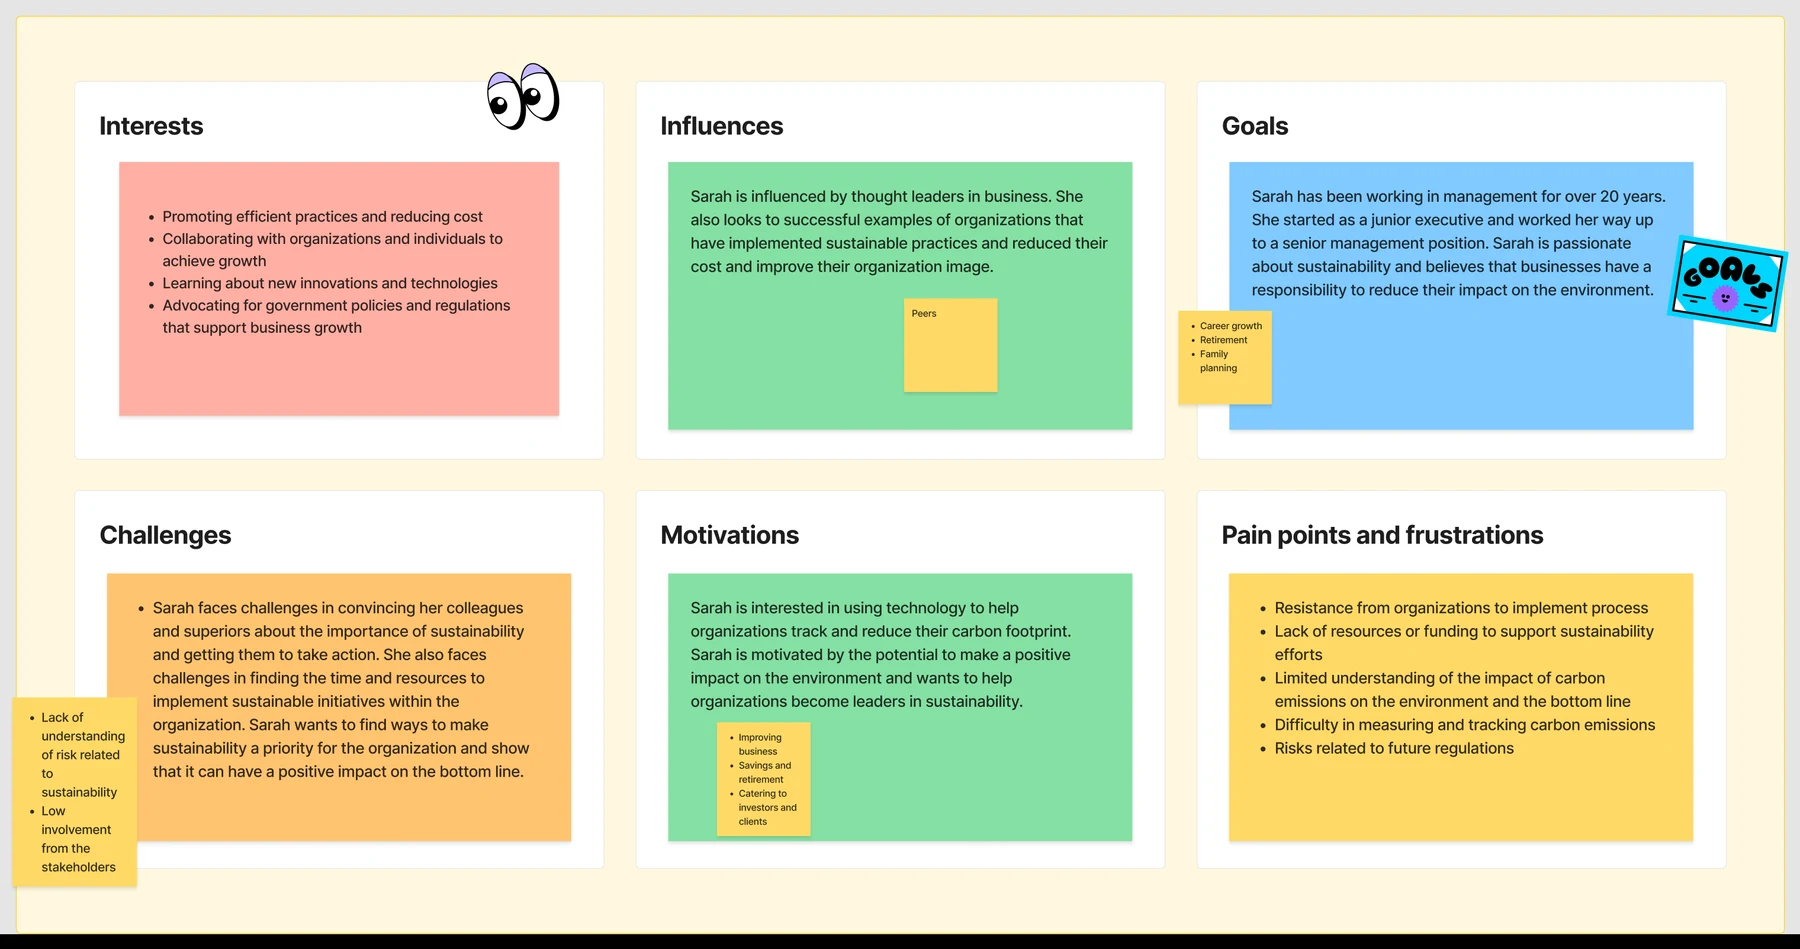
| Gather | Enter | Check | Calculate | Report | |
|---|---|---|---|---|---|
| Doing | Facility teams collect bills, invoices and travel claims for the period | Values are typed into a spreadsheet or form, one line at a time | Someone at head office checks the numbers against the source | Activity data is converted to tonnes of CO2e by scope | Totals are rolled up for leadership and frameworks |
| Pain | Files arrive by email in different formats, often late | Slow and error-prone retyping | No link back to the original bill | Wrong scope or category means a wrong total | Weeks of rework before anyone sees a result |
| Design response | One upload page for spreadsheets, PDFs and images, per facility | AI reads the files and drafts the records | Every record previewed, with an evidence link, and approved before it counts | Emission type, scope and category set on each record | One dashboard, updated as records are approved |
The first ask was a better way to enter emission data. Research moved the focus from the form to the whole life of a record: how it gets in, who checks it, and whether the final number can be trusted.
How might we let each facility hand over its data once, in the form it already has, and give analysts and managers numbers they can trust and act on?
Single records can still be added by hand with Add emission, and go through the same review.
I sketched every step of the upload flow before opening Figma, from the records list to the dashboard. The notes in the margins are the job of each screen. Getting those right on paper meant the high-fidelity work was about detail, not direction.
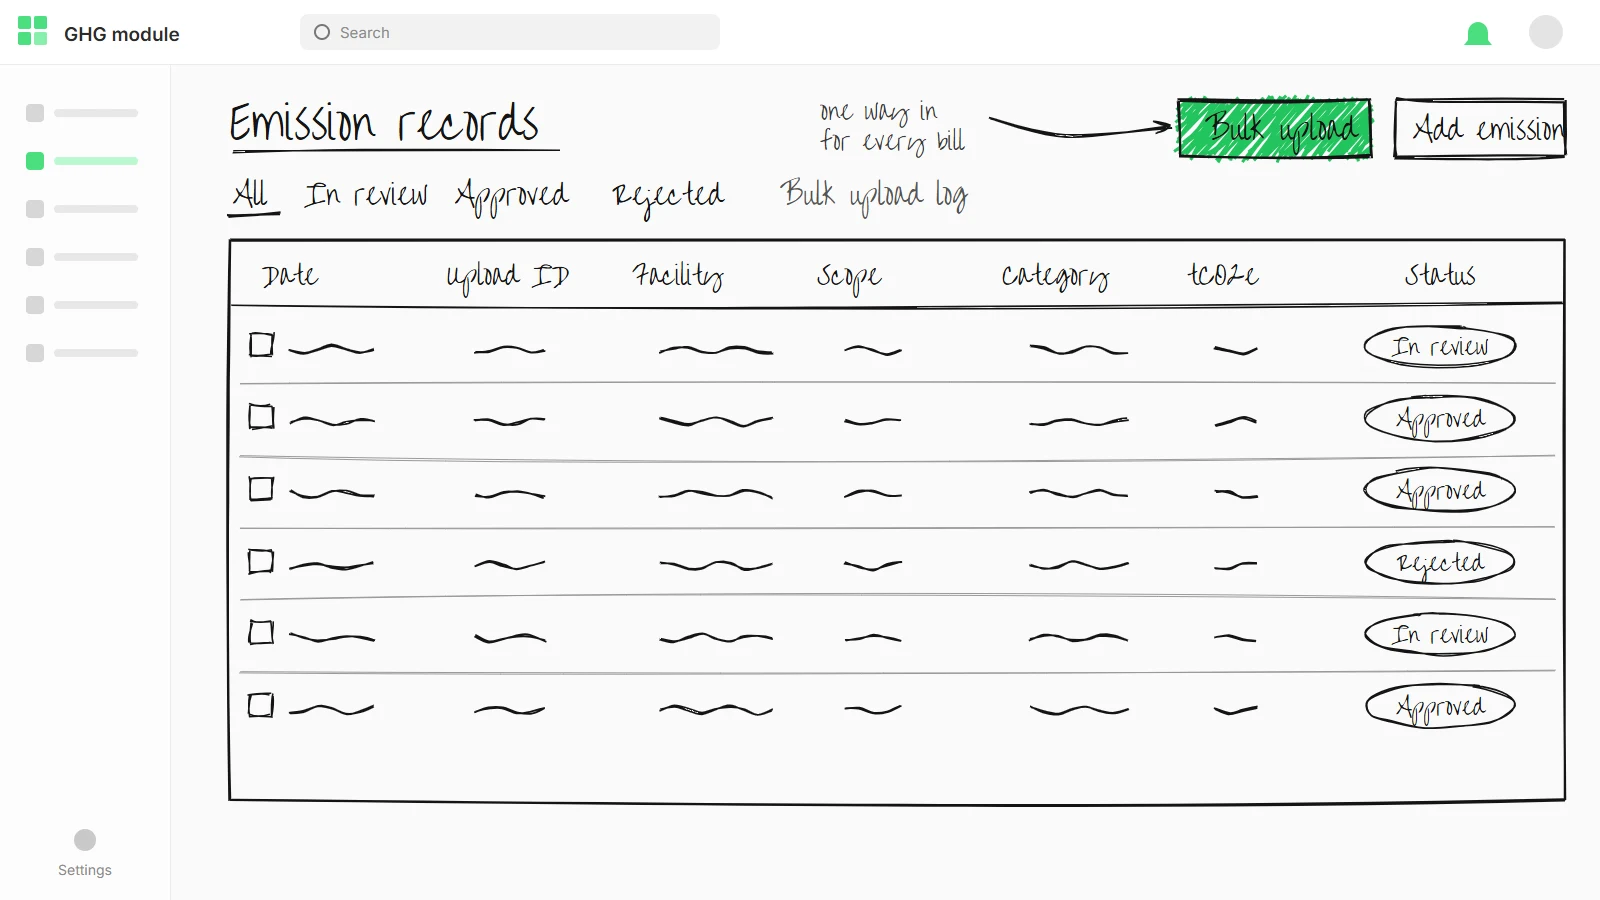
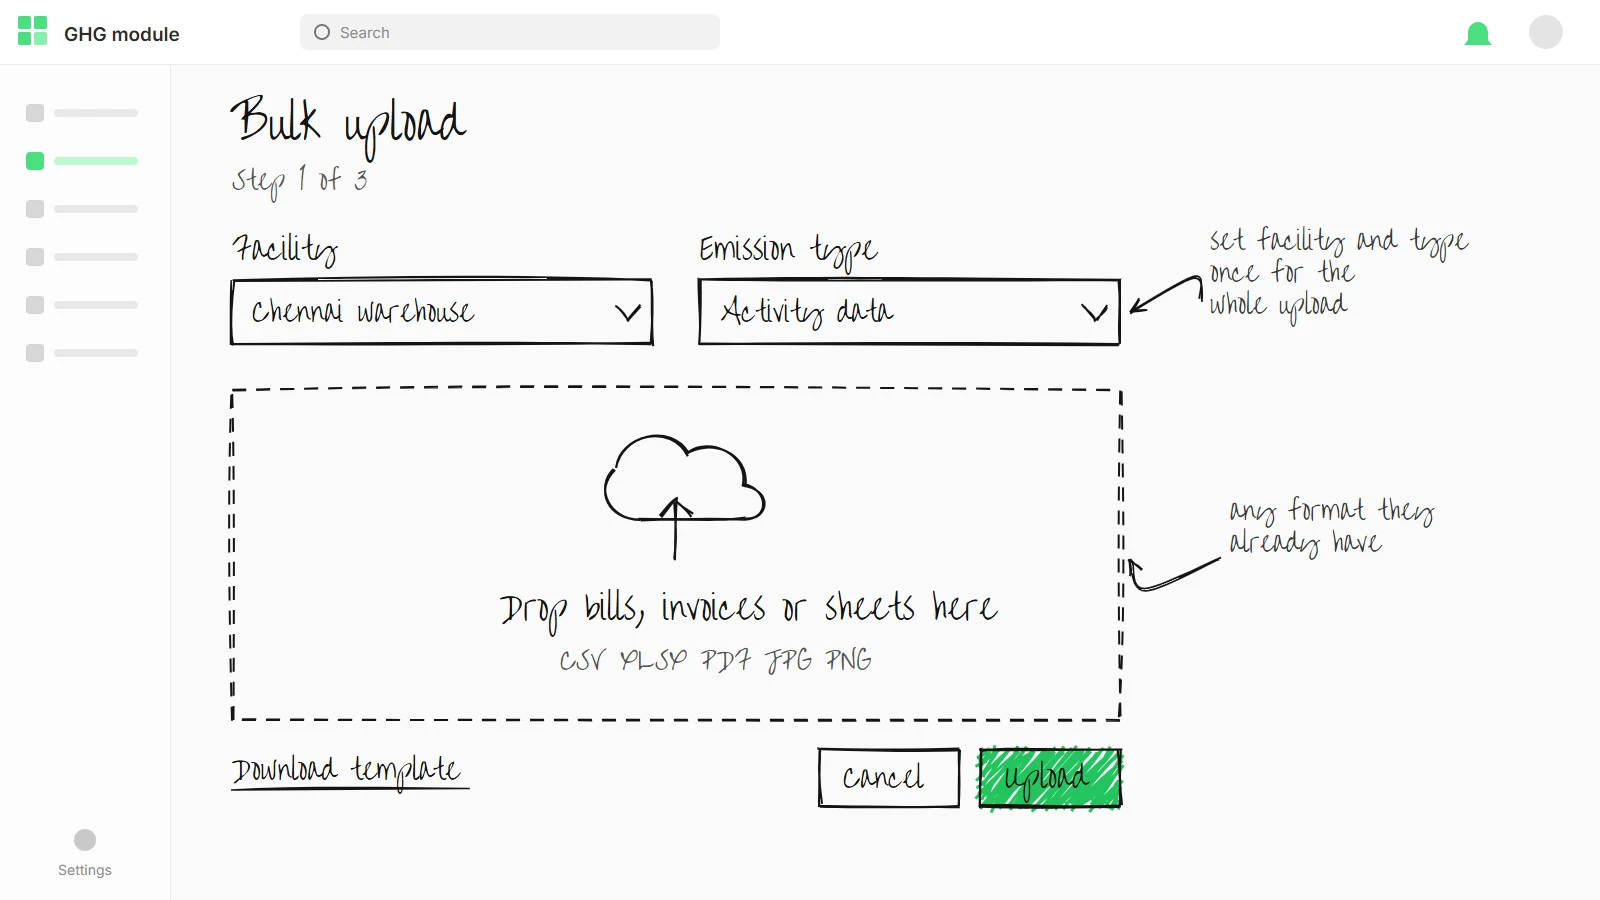
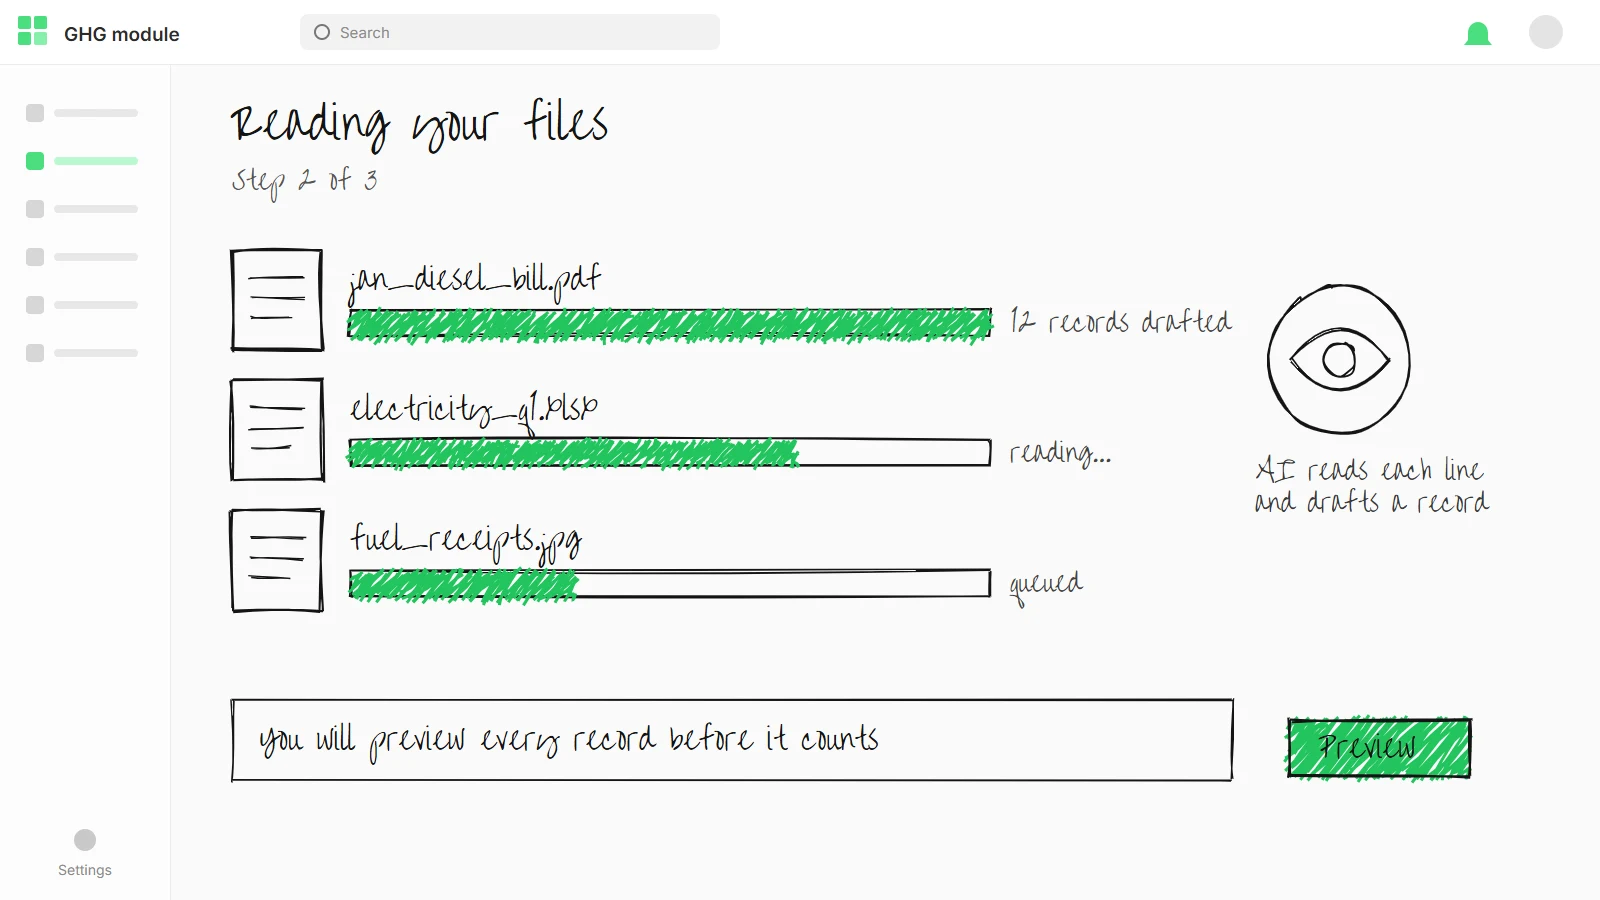
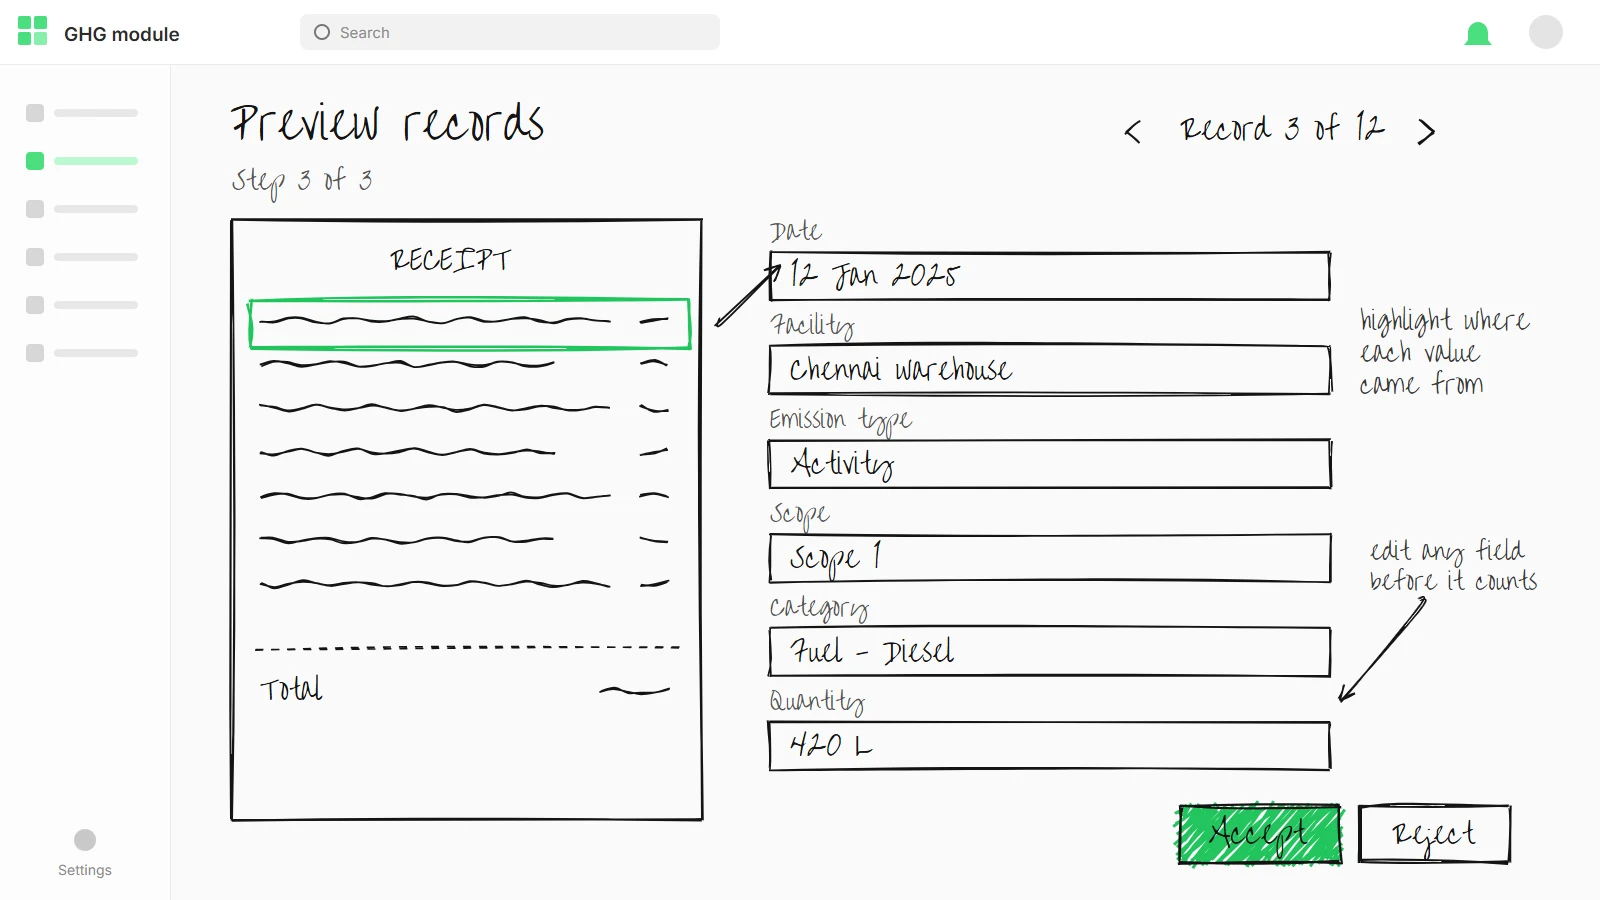
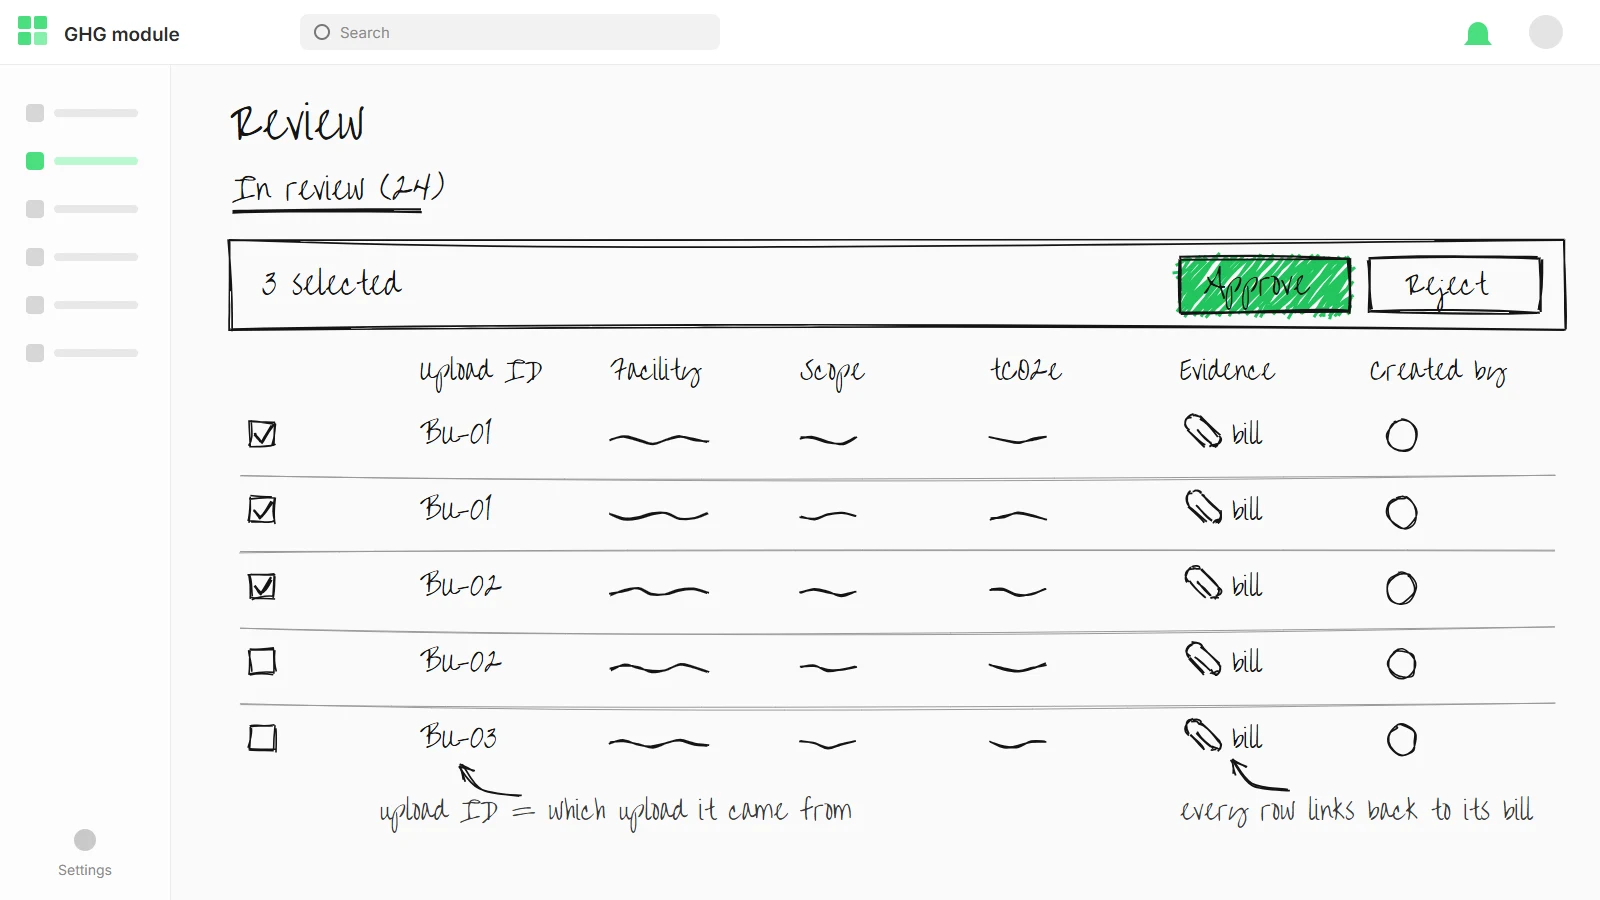
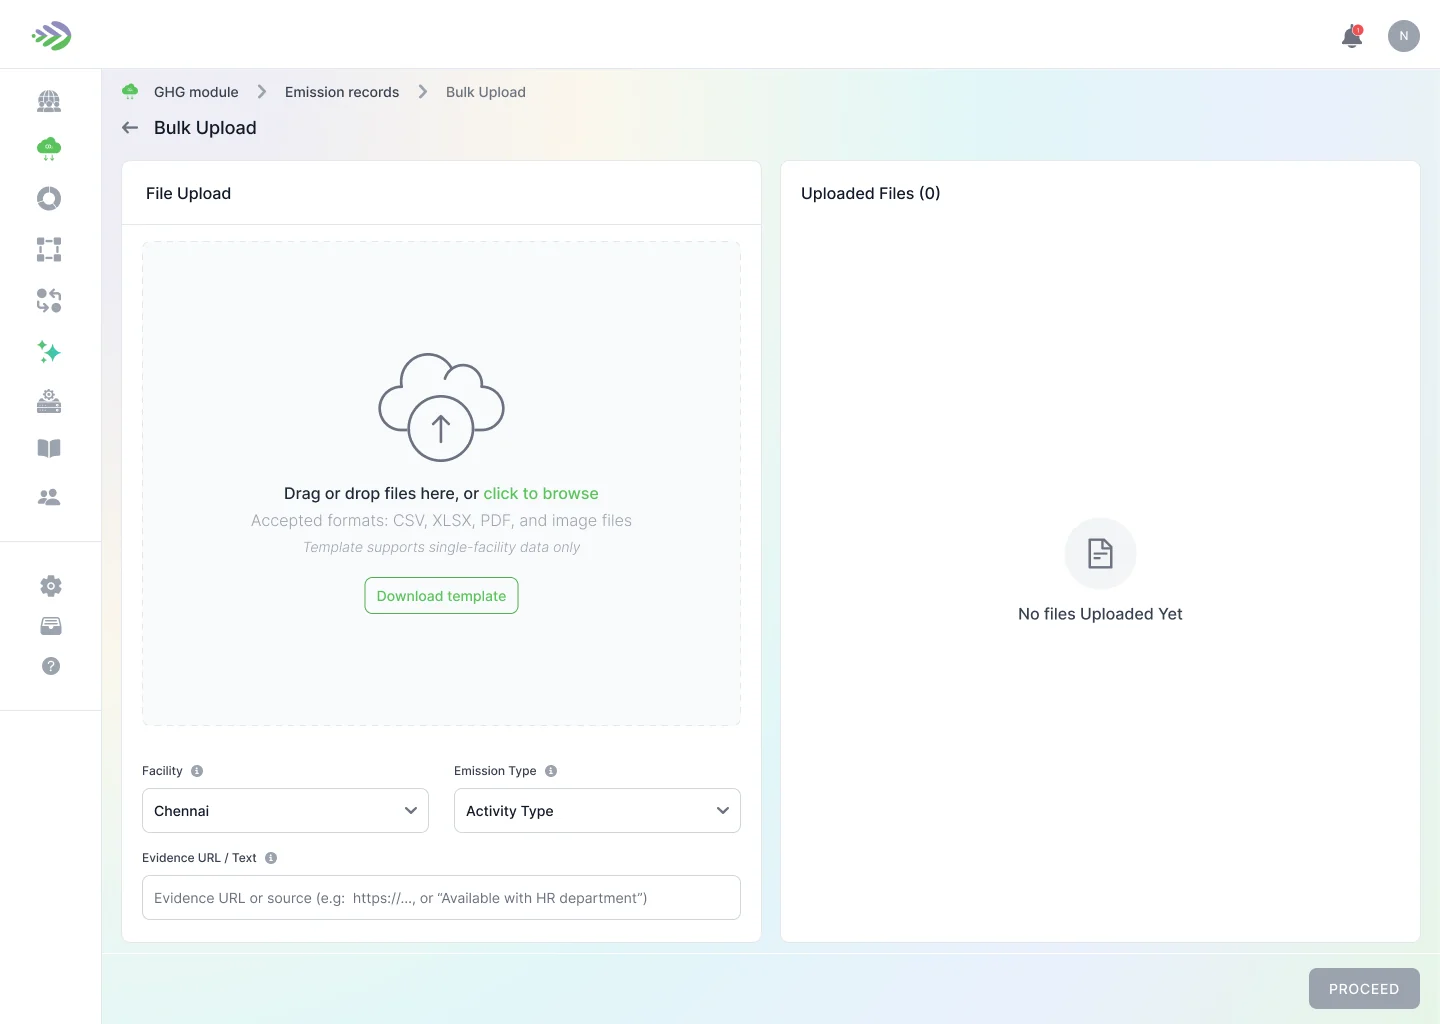
Facility teams already had their data in files, so uploading became the primary action and Add emission the secondary one. The facility and emission type are set once per upload, a template is one click away, and an evidence field keeps the source with the data.
AI reading the files saves the retyping, but it never writes straight into the footprint. Every extracted record opens in a preview to check and edit. The upload screen counts what was accepted and rejected, and rejected rows download as a file to fix and send again.
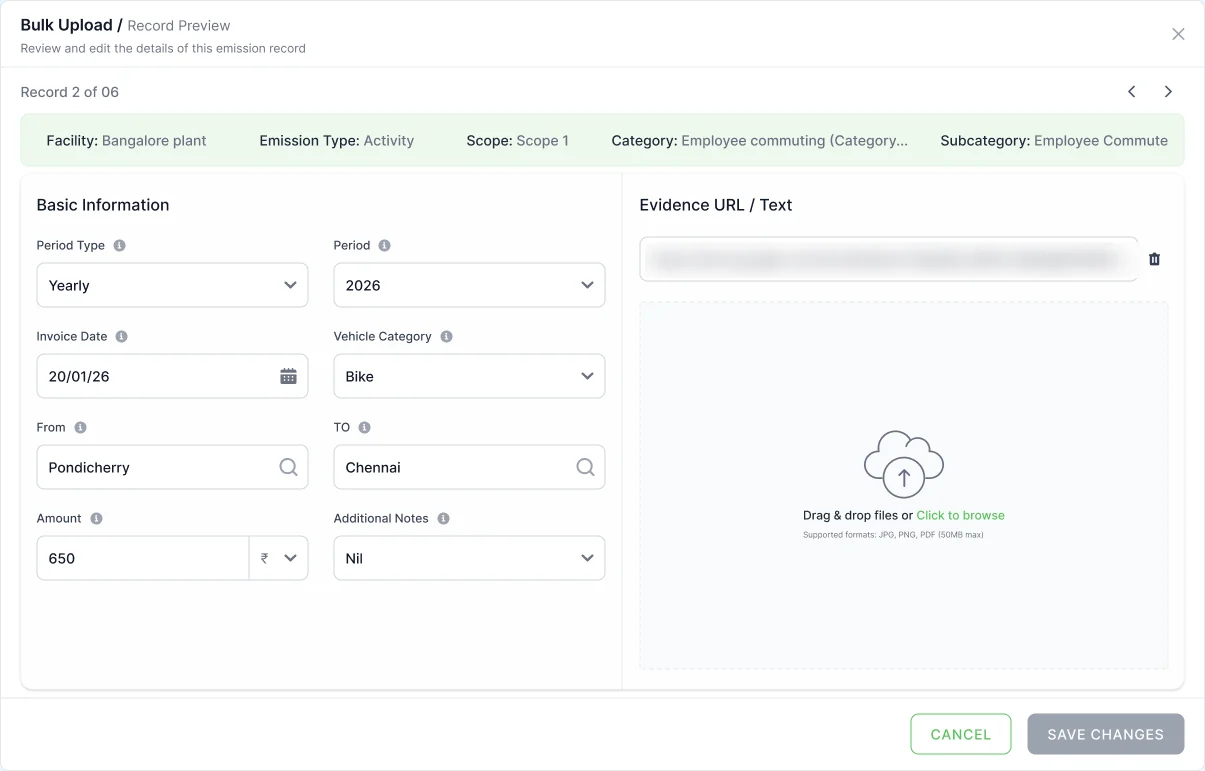
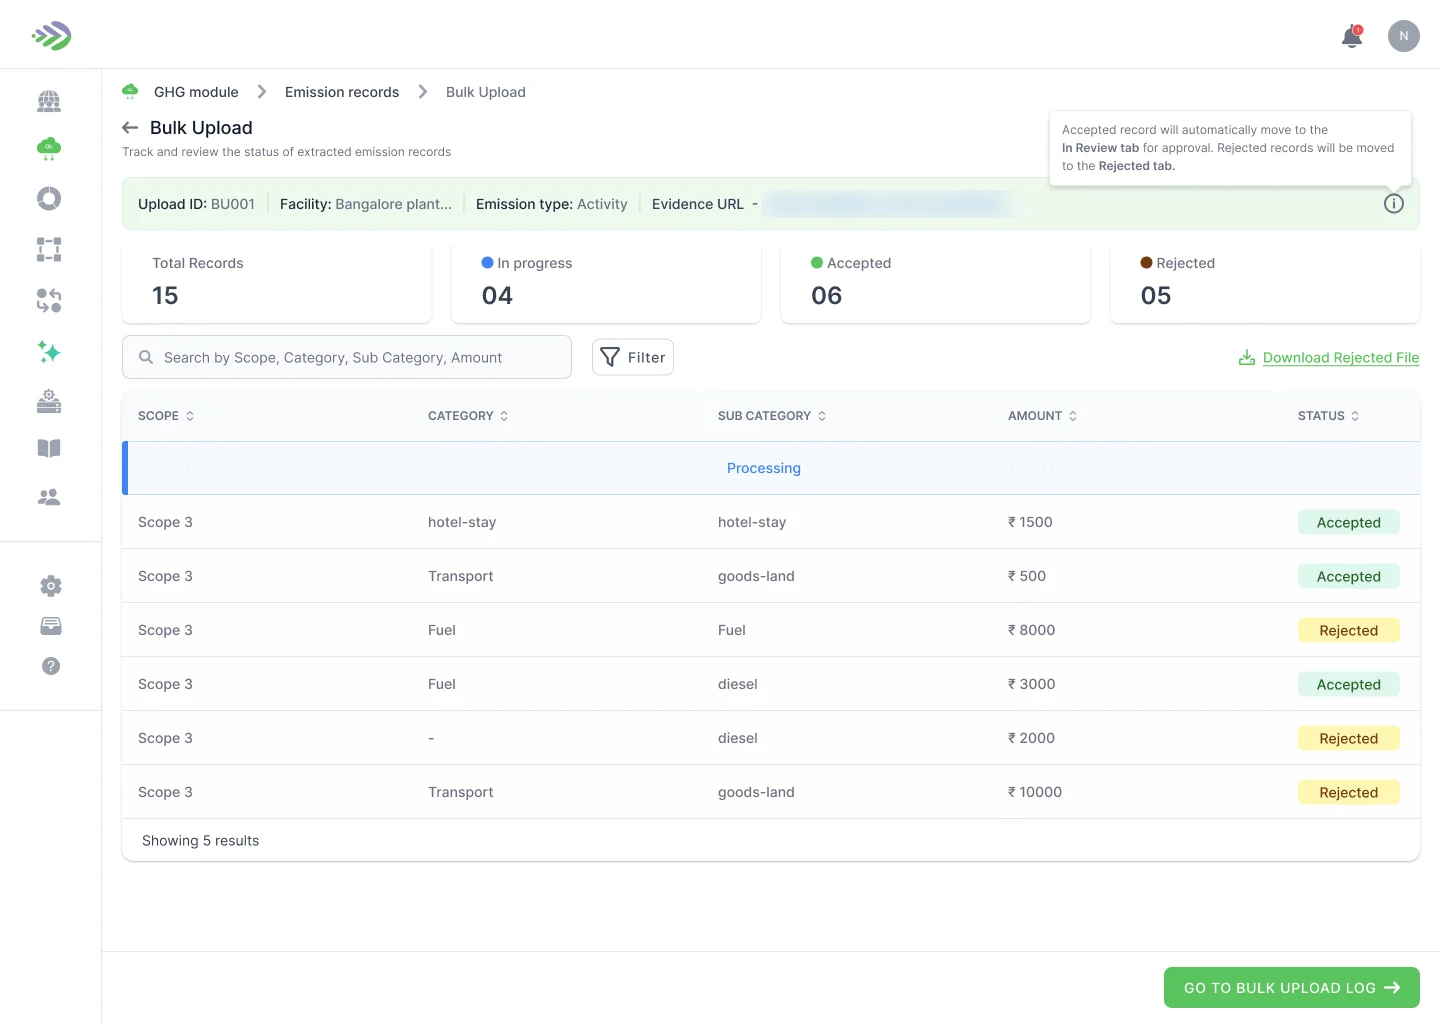
Each record shows when it was uploaded, which upload it came from, who created it and where it stands in review. An analyst can follow any number on the dashboard back to the bill behind it, which is what assurance needs.
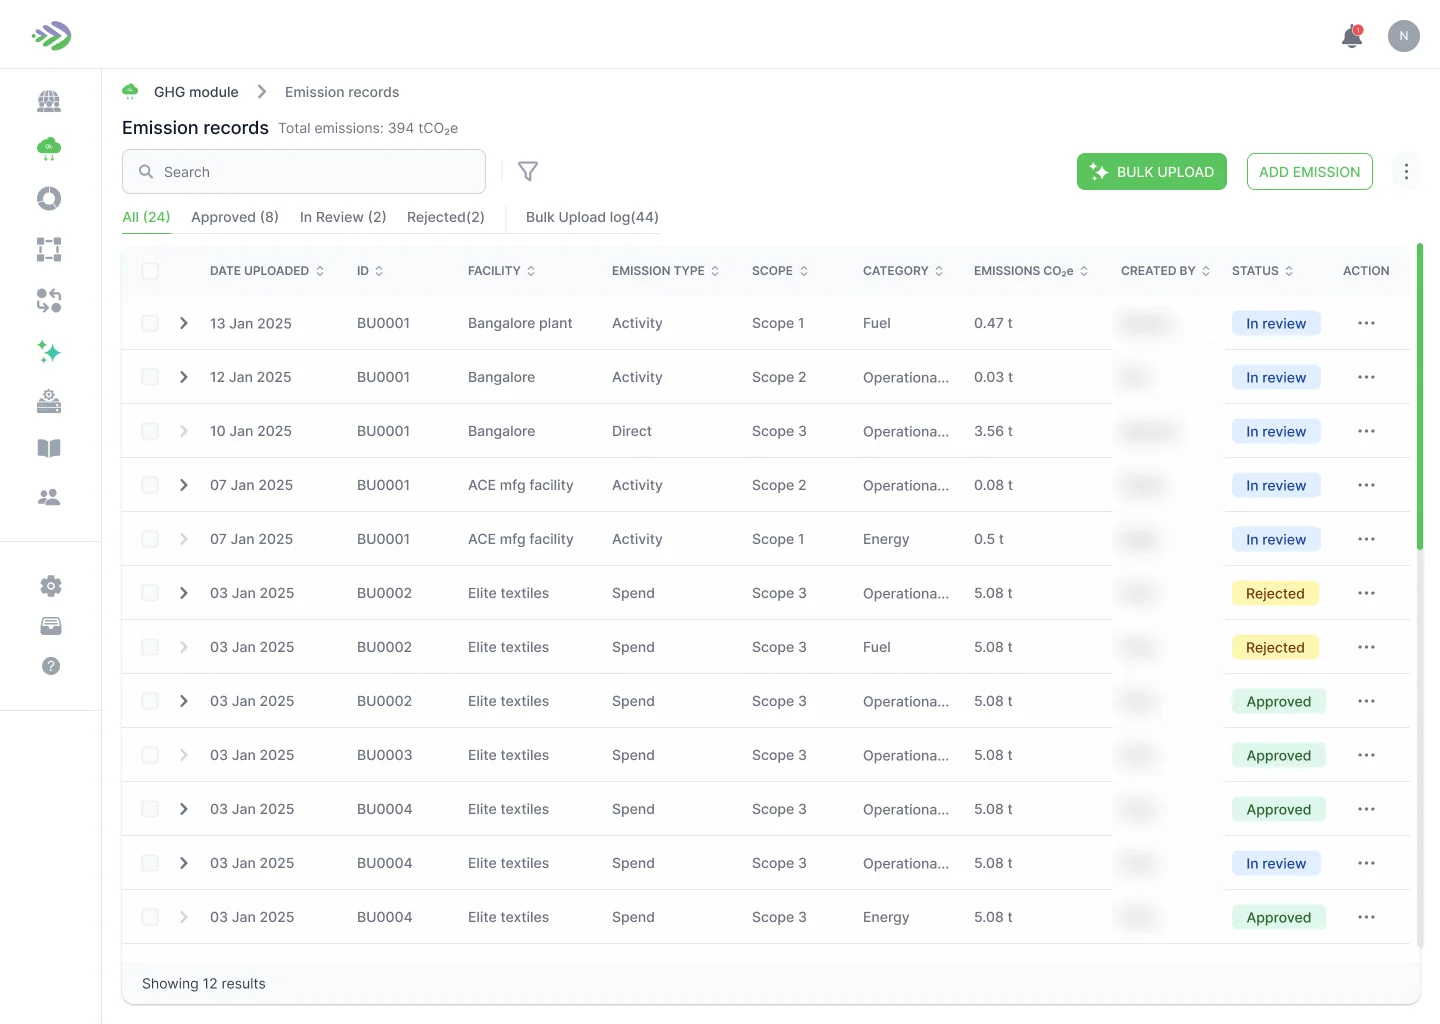
I split the module between the designers by flow, data collection, emission records and the dashboard, and kept them consistent through weekly design reviews and the Bevolve design system I built. I wrote the requirements with product and engineering in Agile sprints, and ran design QA on every build before release.
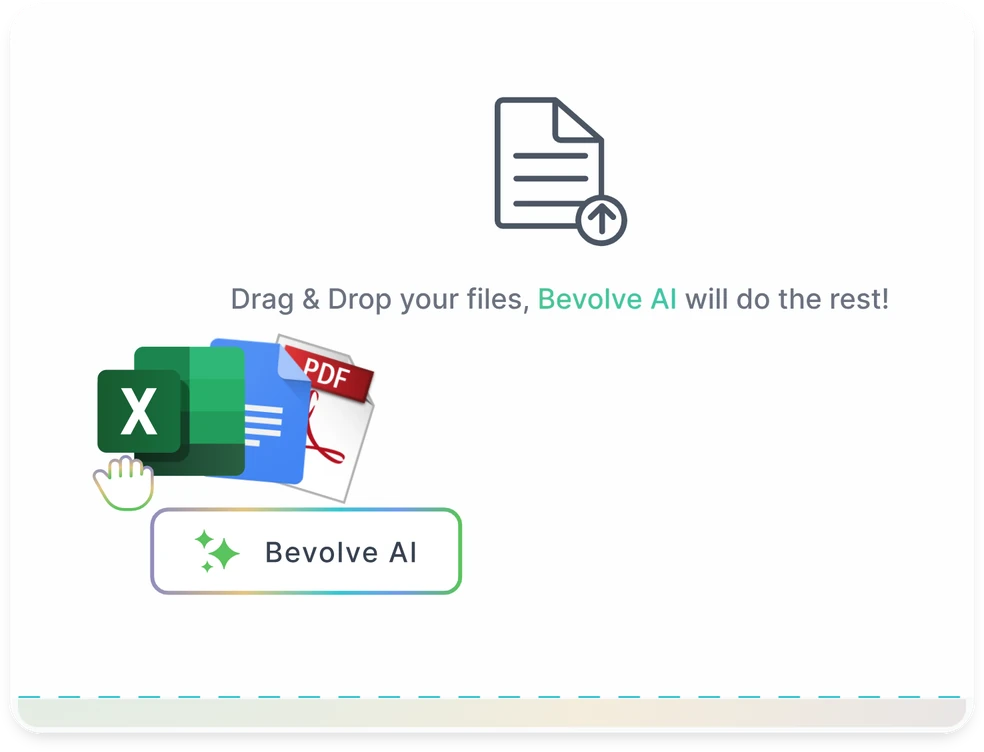
Drop spreadsheets, documents, or PDFs, and Bevolve AI reads the activity data out of them, so nobody retypes a meter reading.
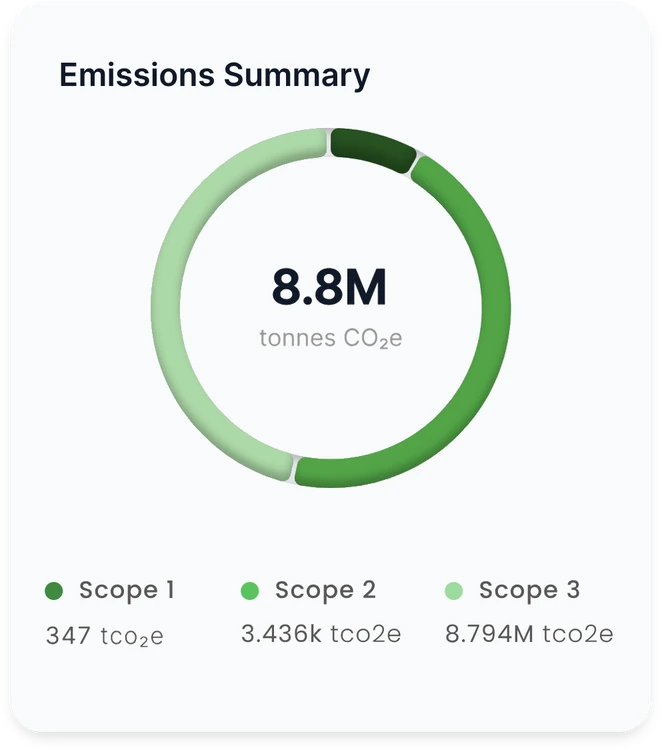
The organisation's total footprint in one number, split into Scope 1, 2, and 3.
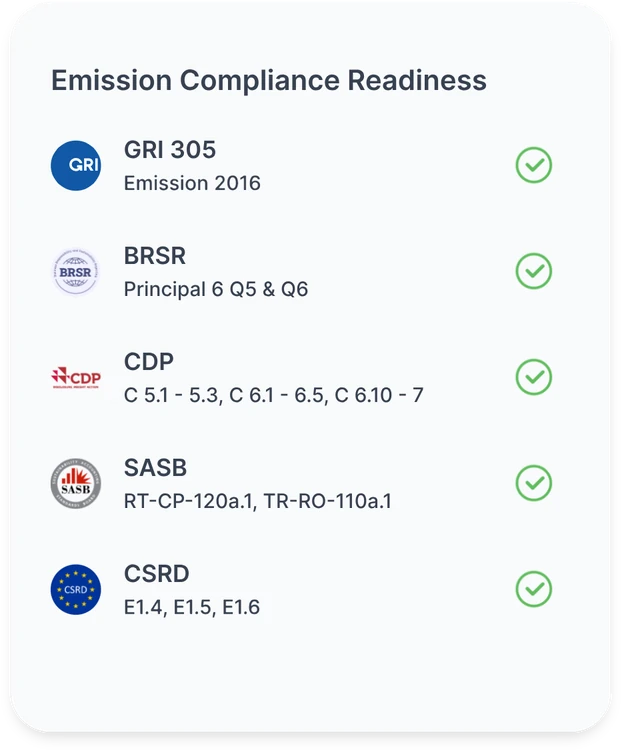
Where the data stands against GRI 305, BRSR, CDP, SASB, and CSRD, at a glance.
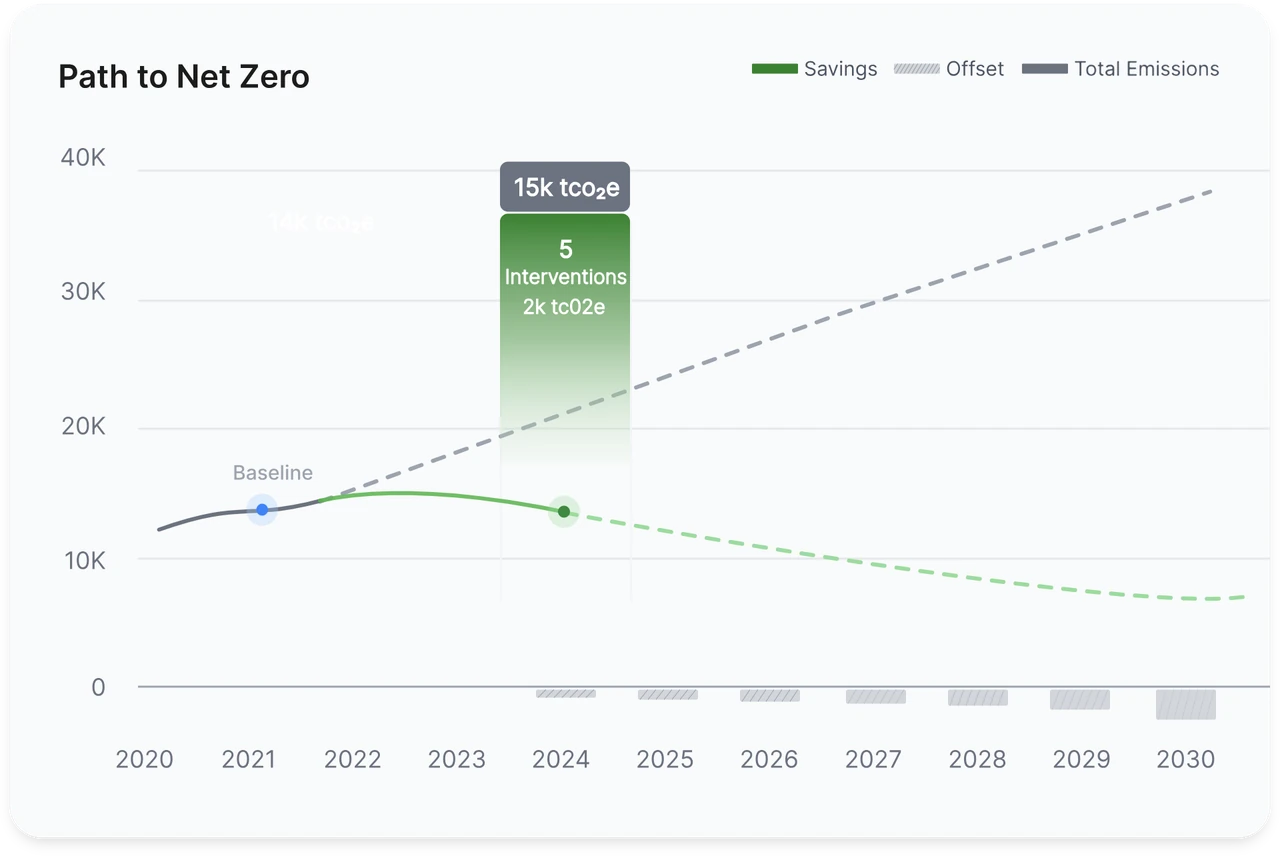
Baseline to 2030, with and without interventions, plus offsets, so the gap to target is visible.
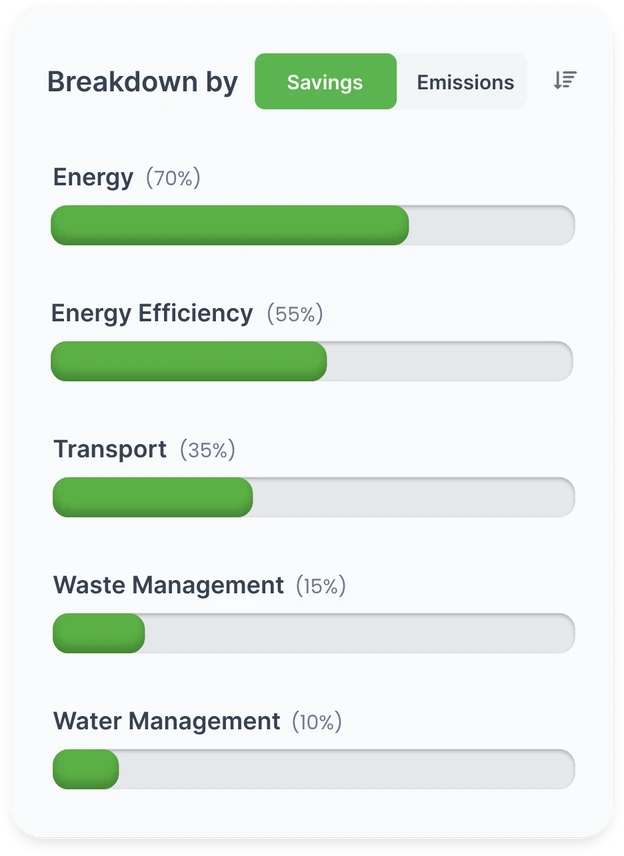
Which categories the reductions come from, with a toggle between savings and emissions.
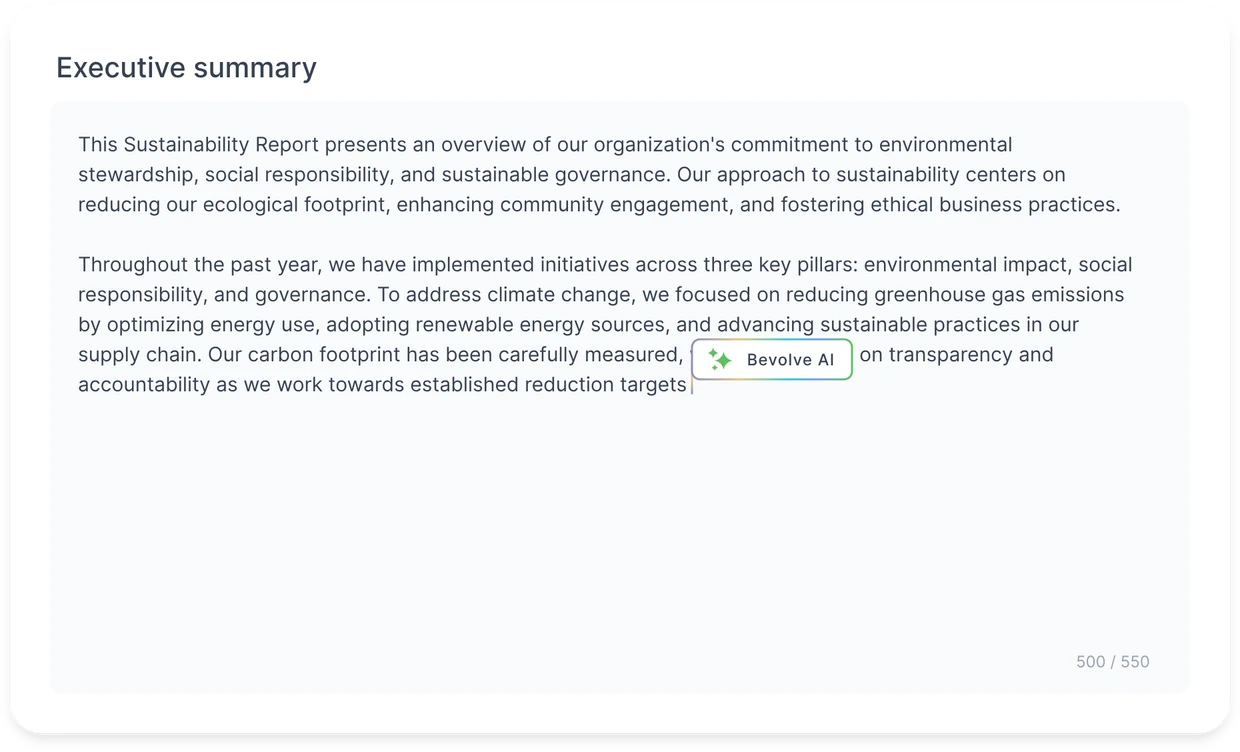
Bevolve AI drafts the executive summary for reporting straight from the numbers.
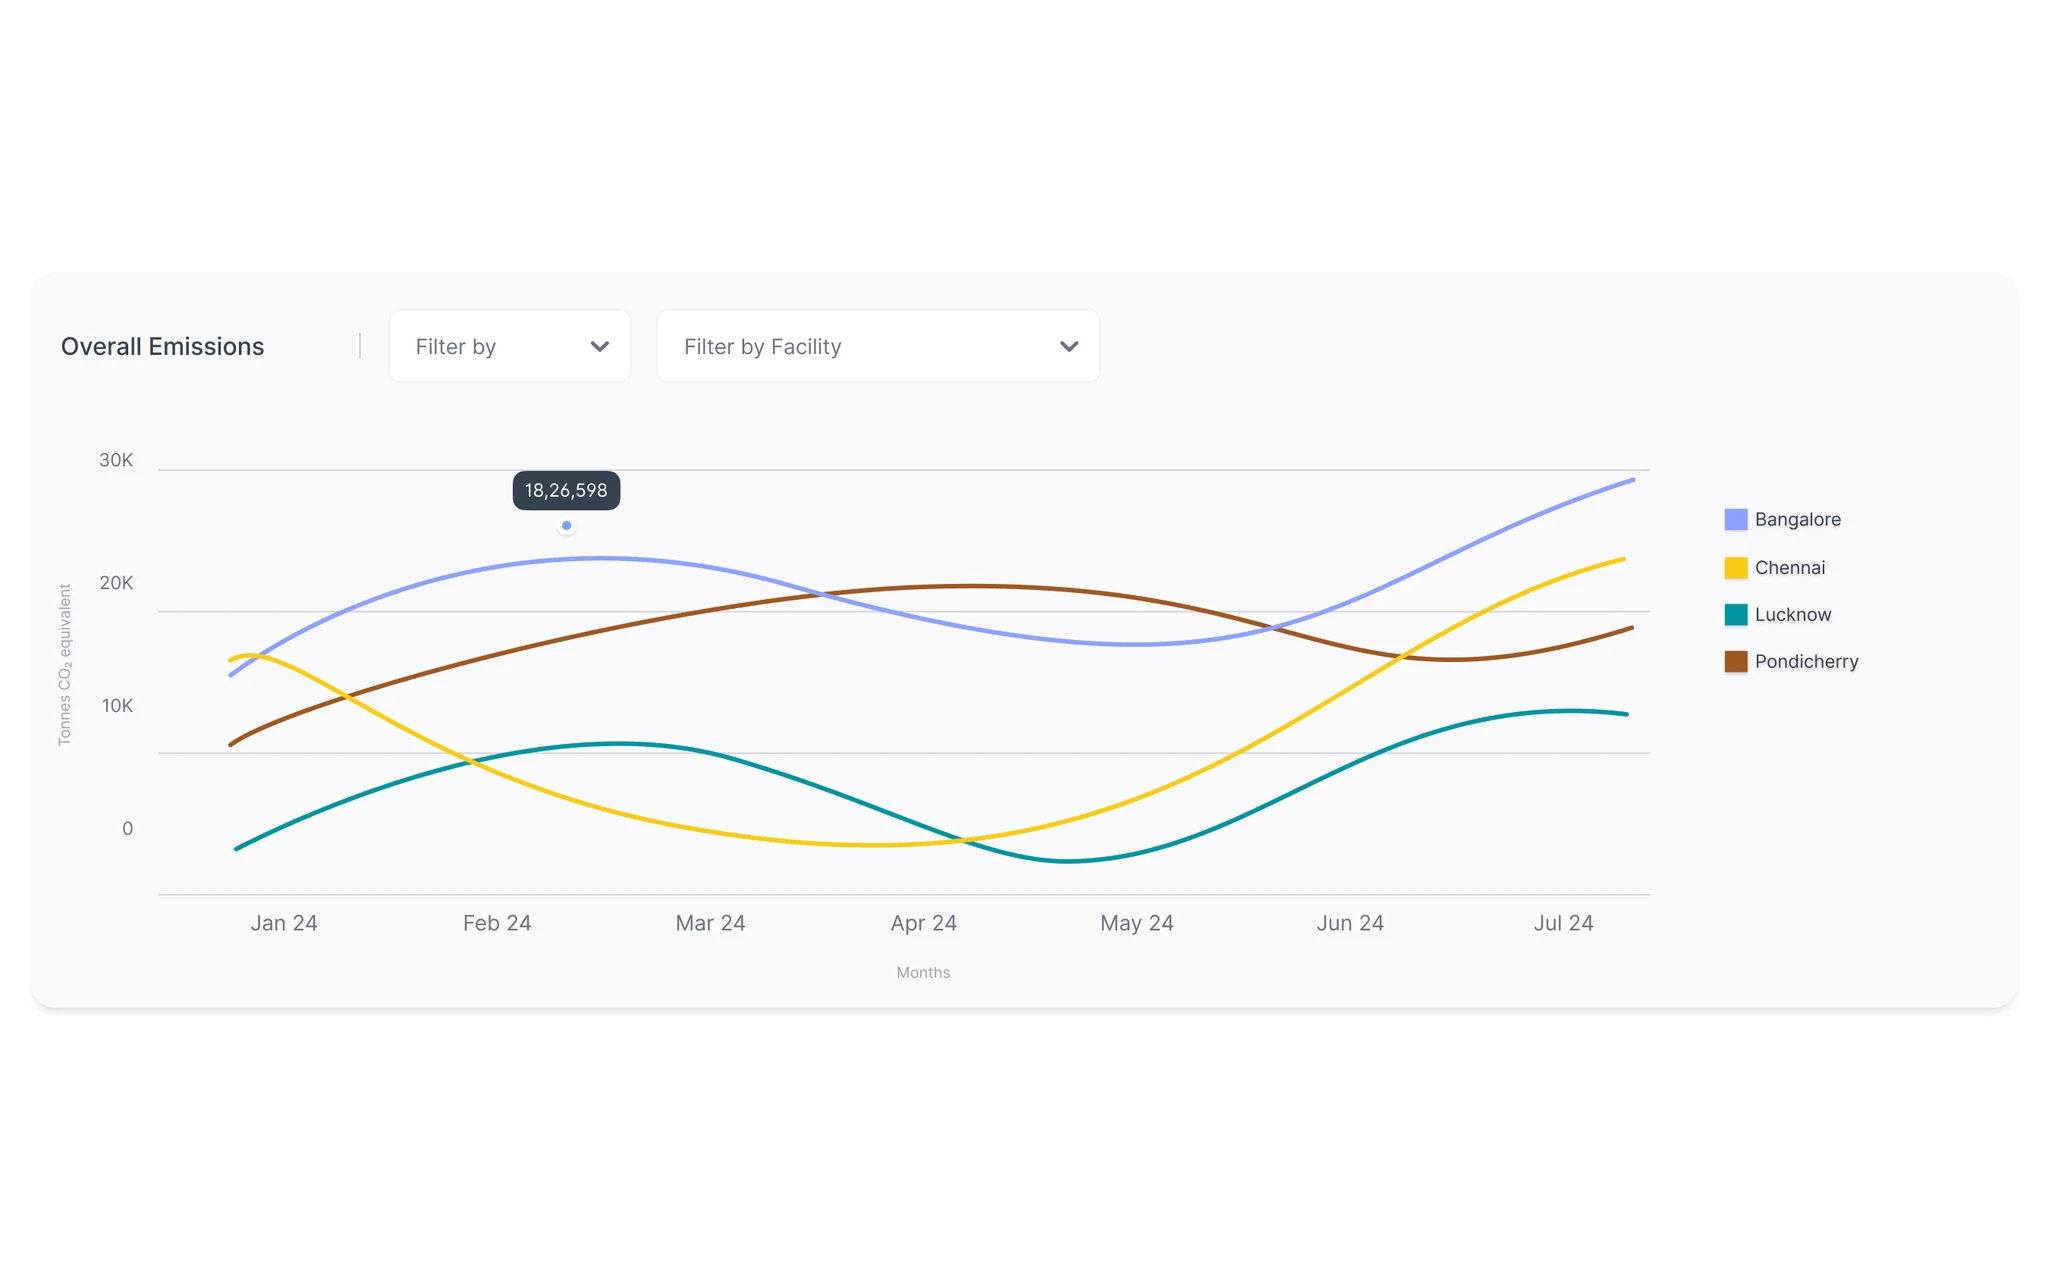
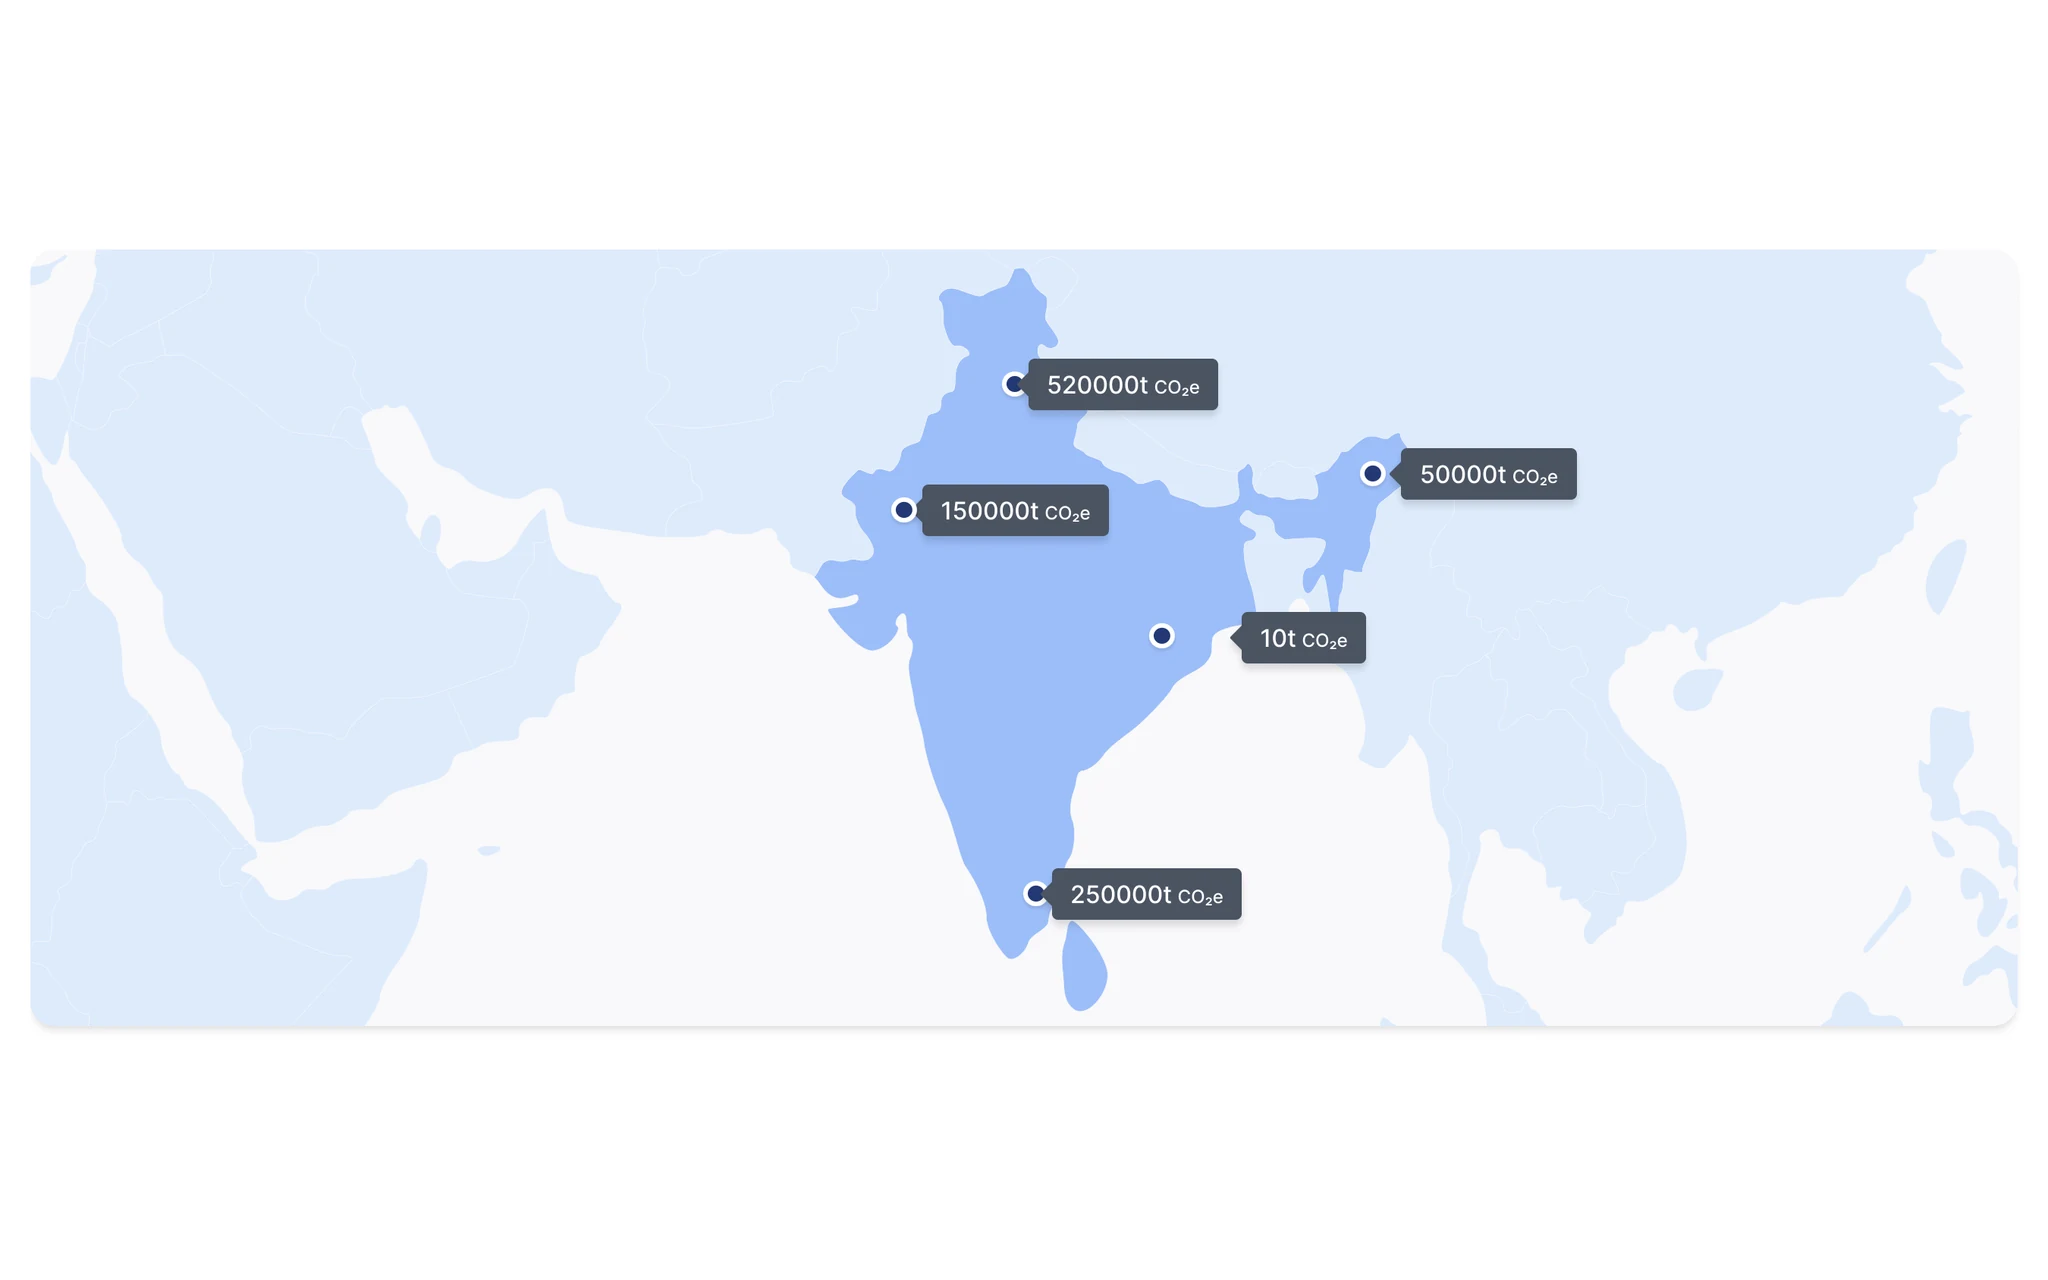
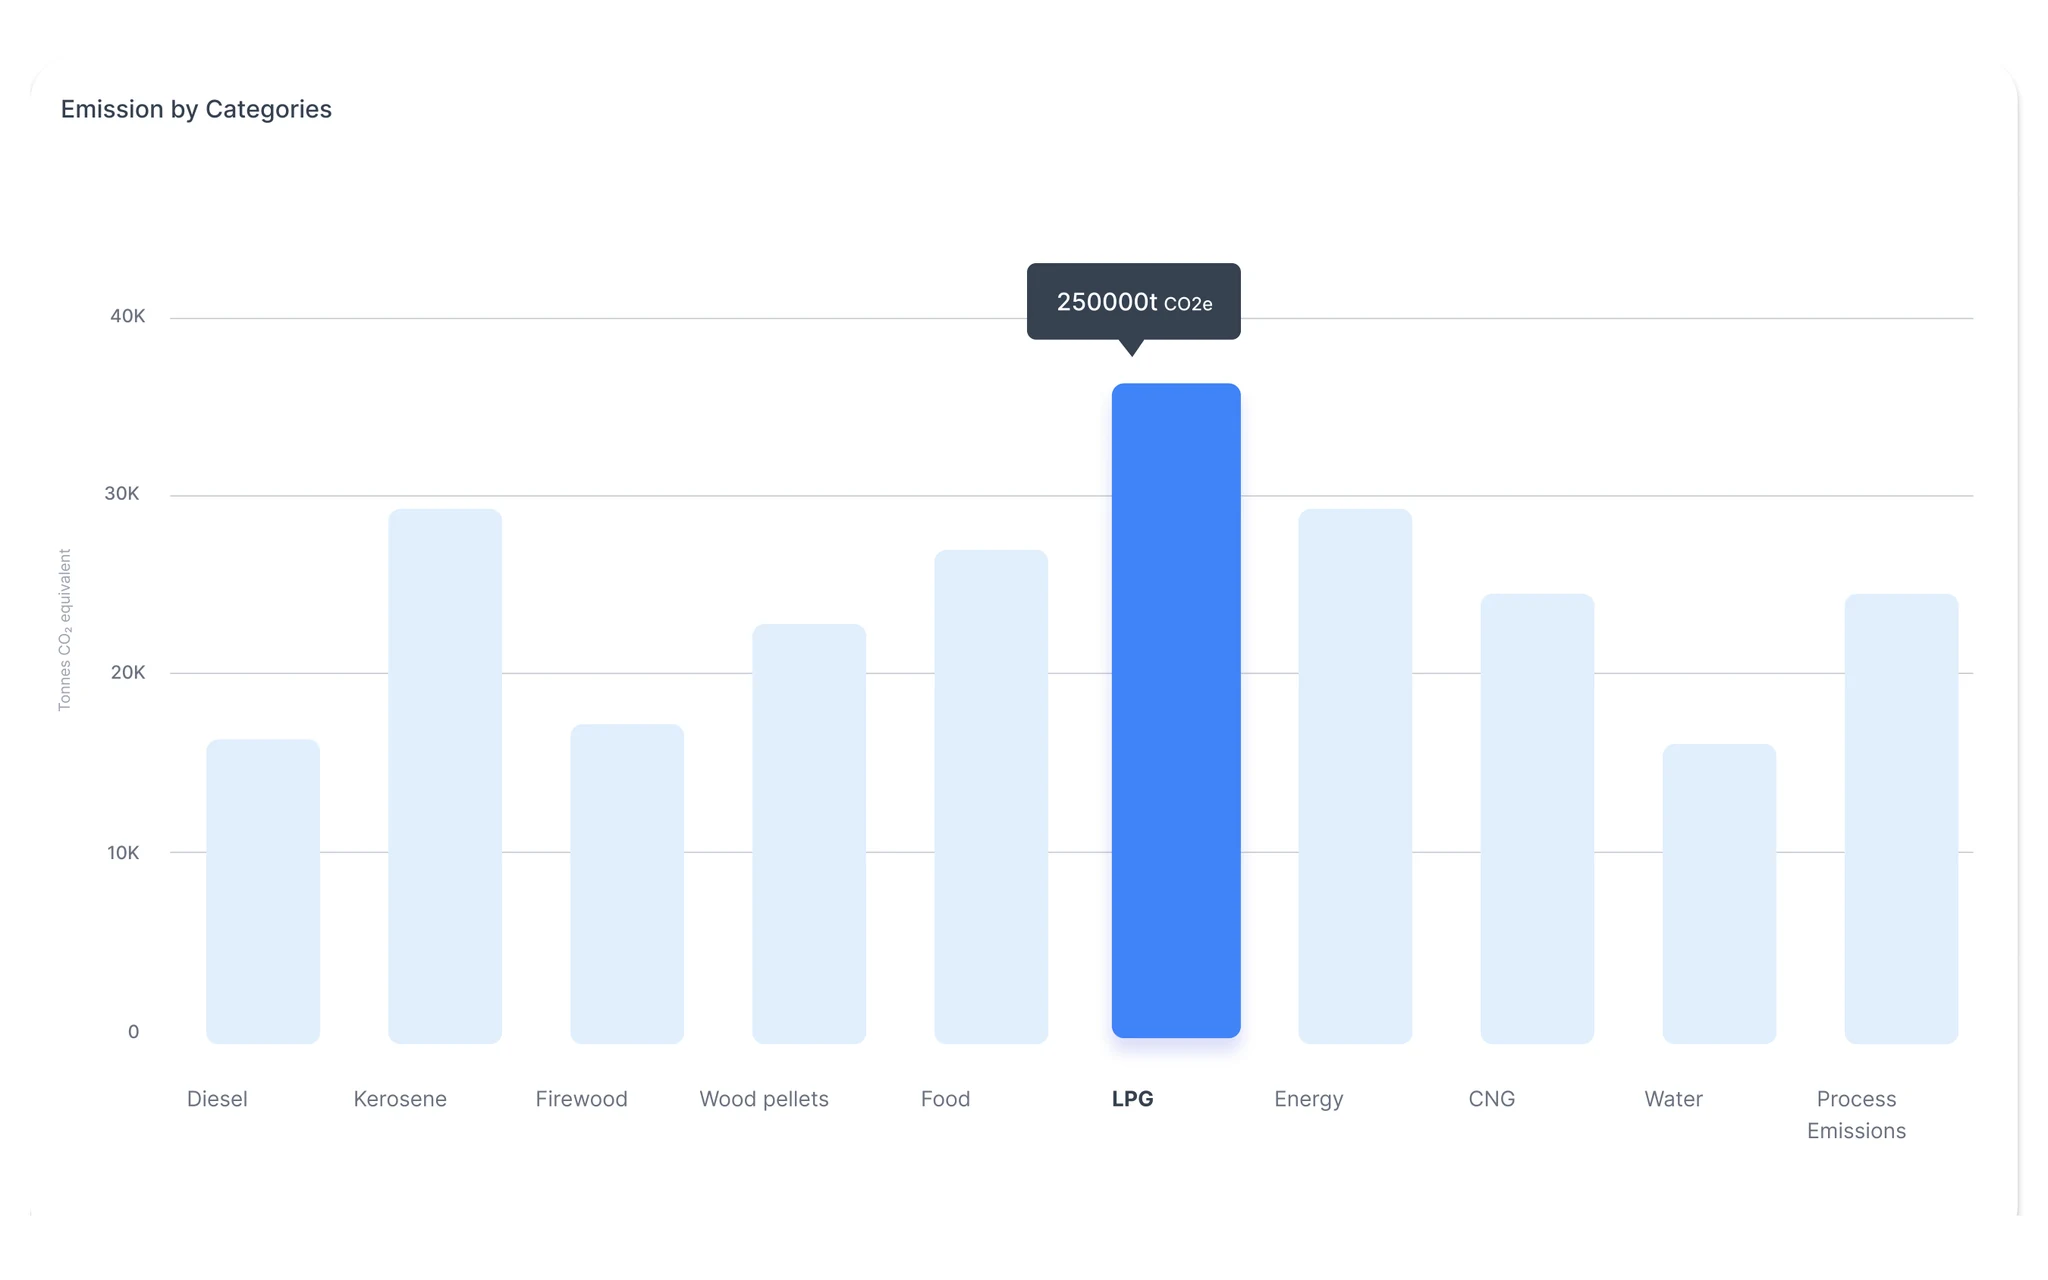
The widget overview sits at the top; below it, emissions over time by facility, a map of where emissions happen, and a breakdown by category, from diesel and LPG to water and process emissions.
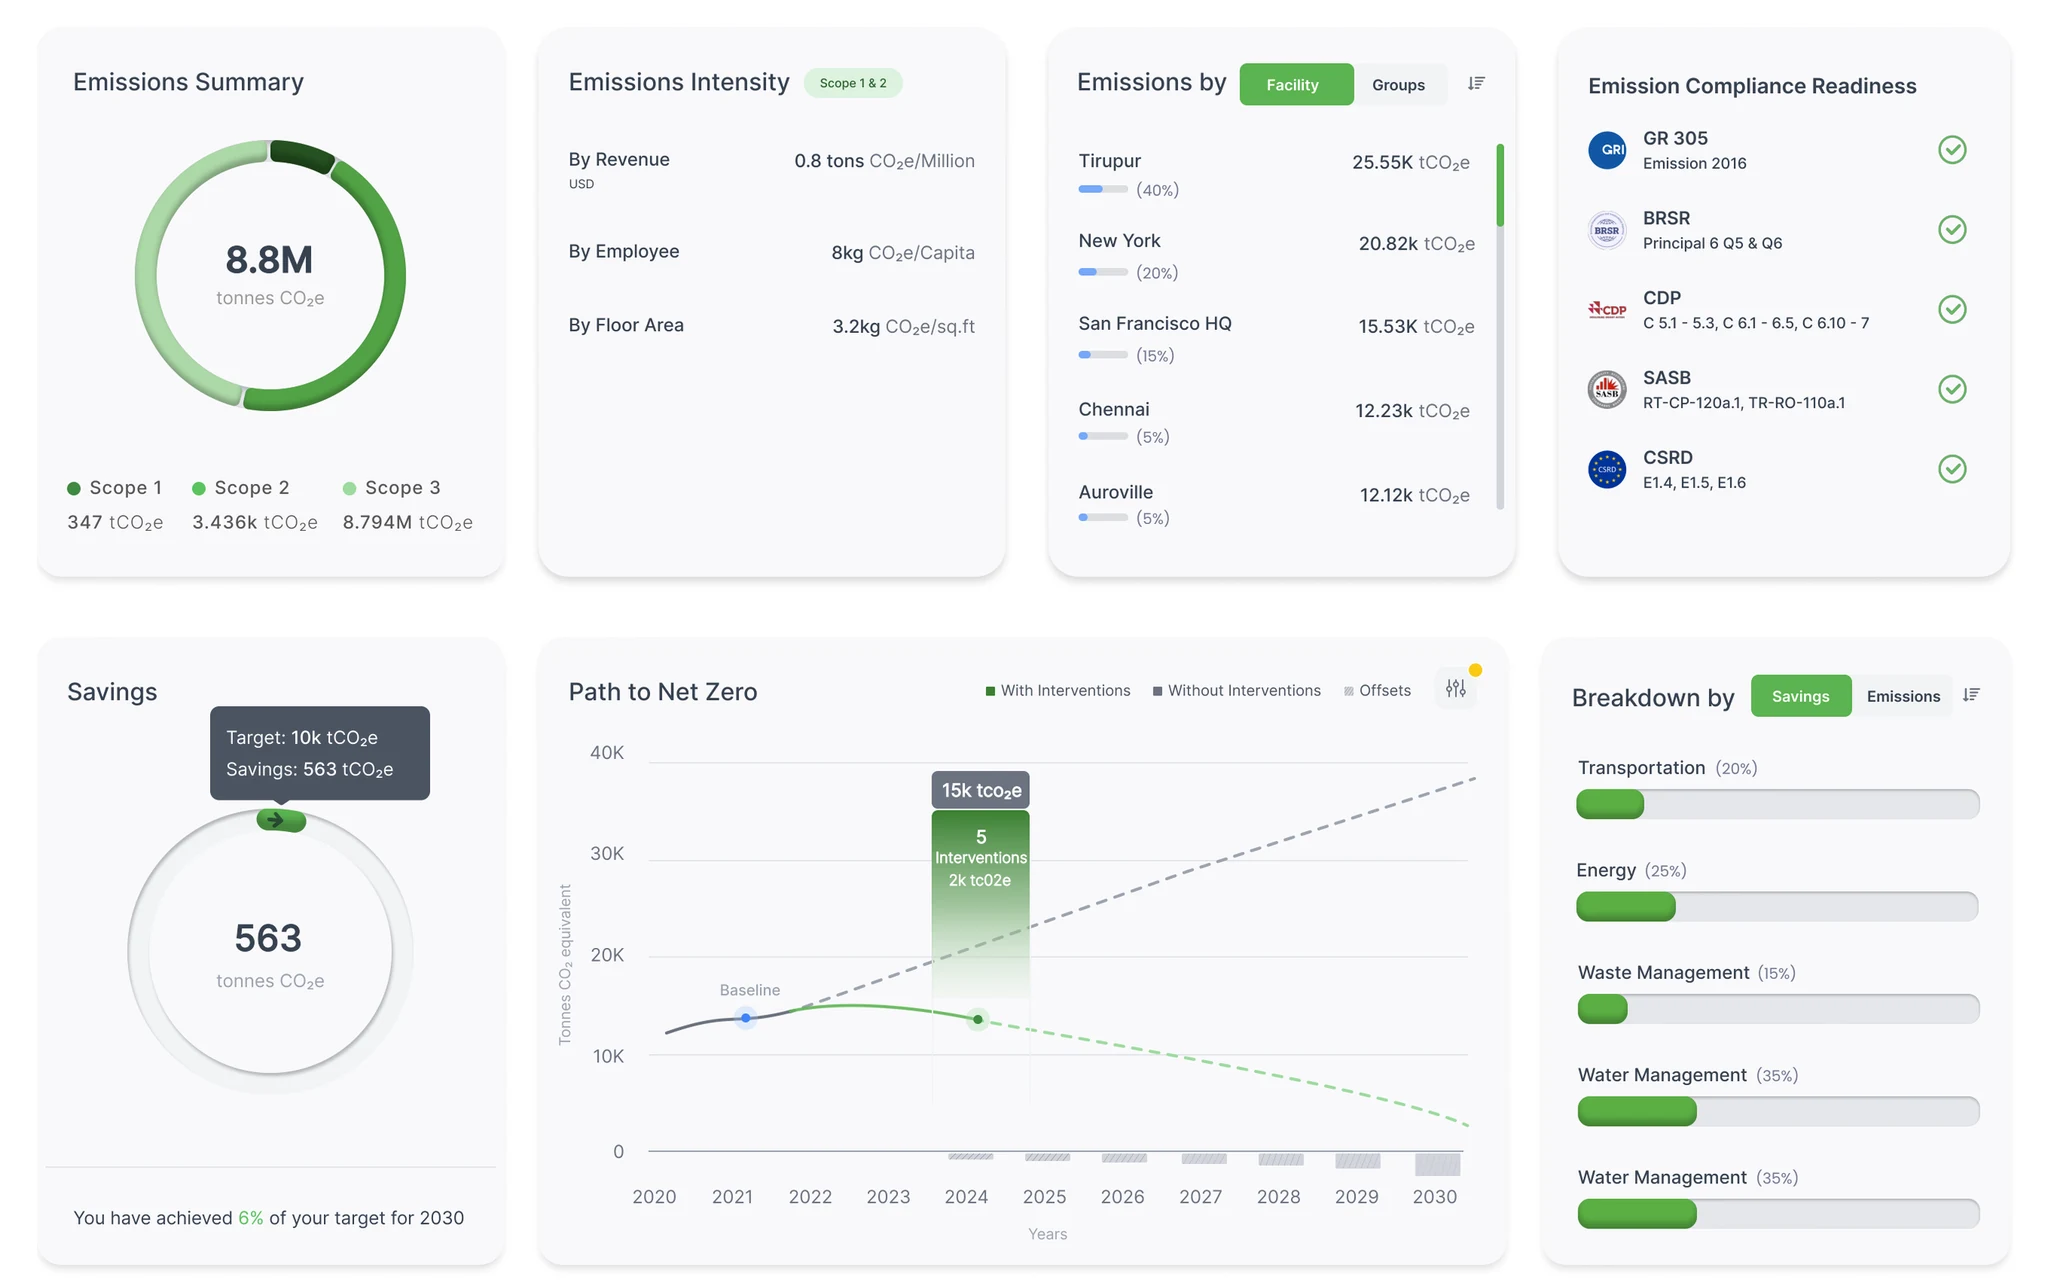
GHG Accounting is live inside the Bevolve platform. The design work helped win new clients, and the reworked onboarding made set-up faster for clients. Facility teams now hand over files instead of retyping them, and every number on the dashboard can be traced back to its source.
With AI in the flow, the design work moves from data entry to trust. The most important screens turned out to be the preview and the review queue, not the upload itself.
Let a facility manager see only their own site's data collection tasks, so the organisation-level dashboard fills in without anyone chasing spreadsheets.