← Back to work
SaaS · Supply Chain · Scope 3
Turning an OEM's hardest emissions number, Scope 3, into surveys its suppliers can actually answer.
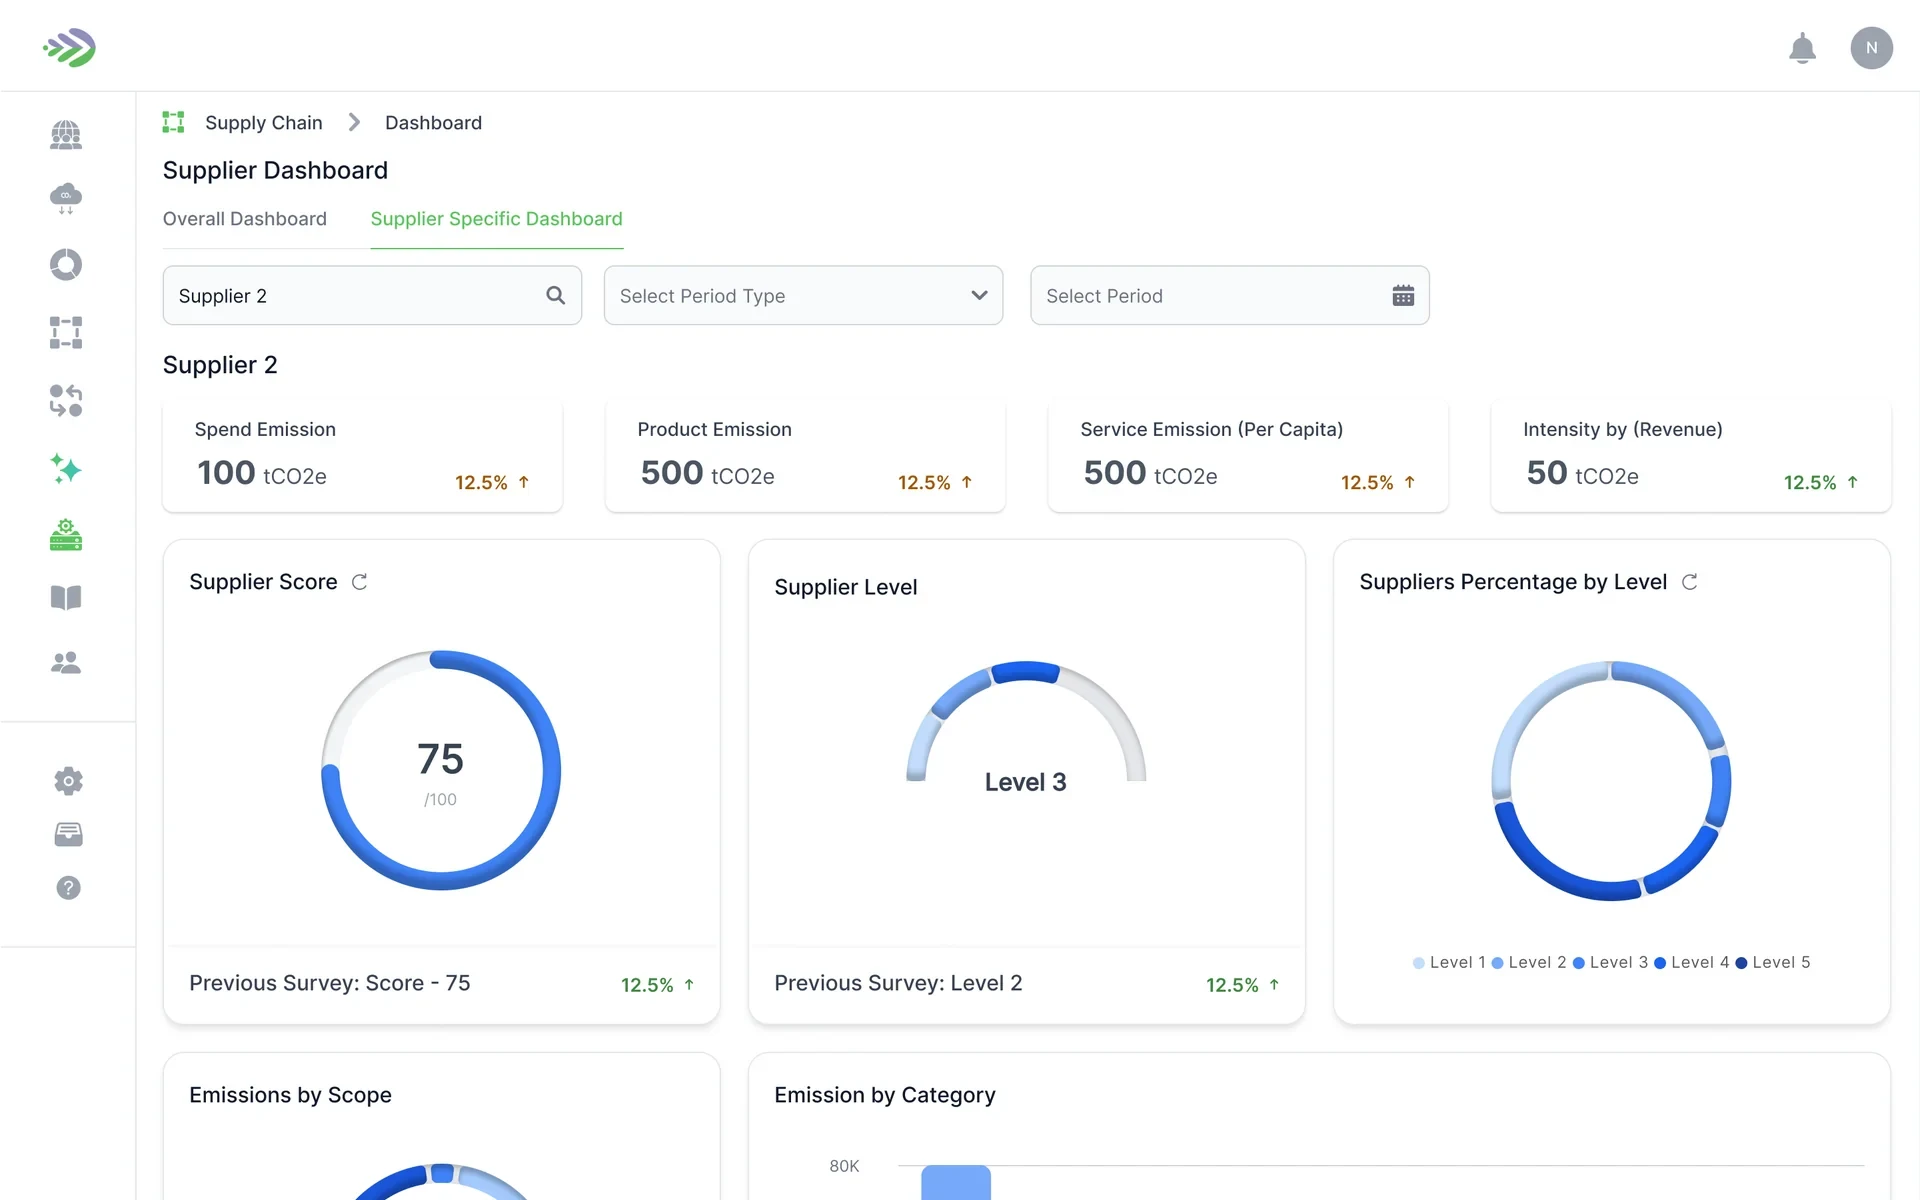
A standalone module that lets an OEM (original equipment manufacturer) measure the emissions in its supply chain. The OEM onboards its suppliers, who can onboard their own, all captured as a multi-tier hierarchy. The OEM then assigns surveys, suppliers fill in their emission data and send it back, and every response rolls up into a supplier dashboard that shows the OEM its Scope 3 picture.
Most of an OEM's footprint sits in its supply chain, across tiers of suppliers it doesn't directly control. Getting that data meant chasing each supplier separately, with no shared structure for what to ask or how to compare the answers.
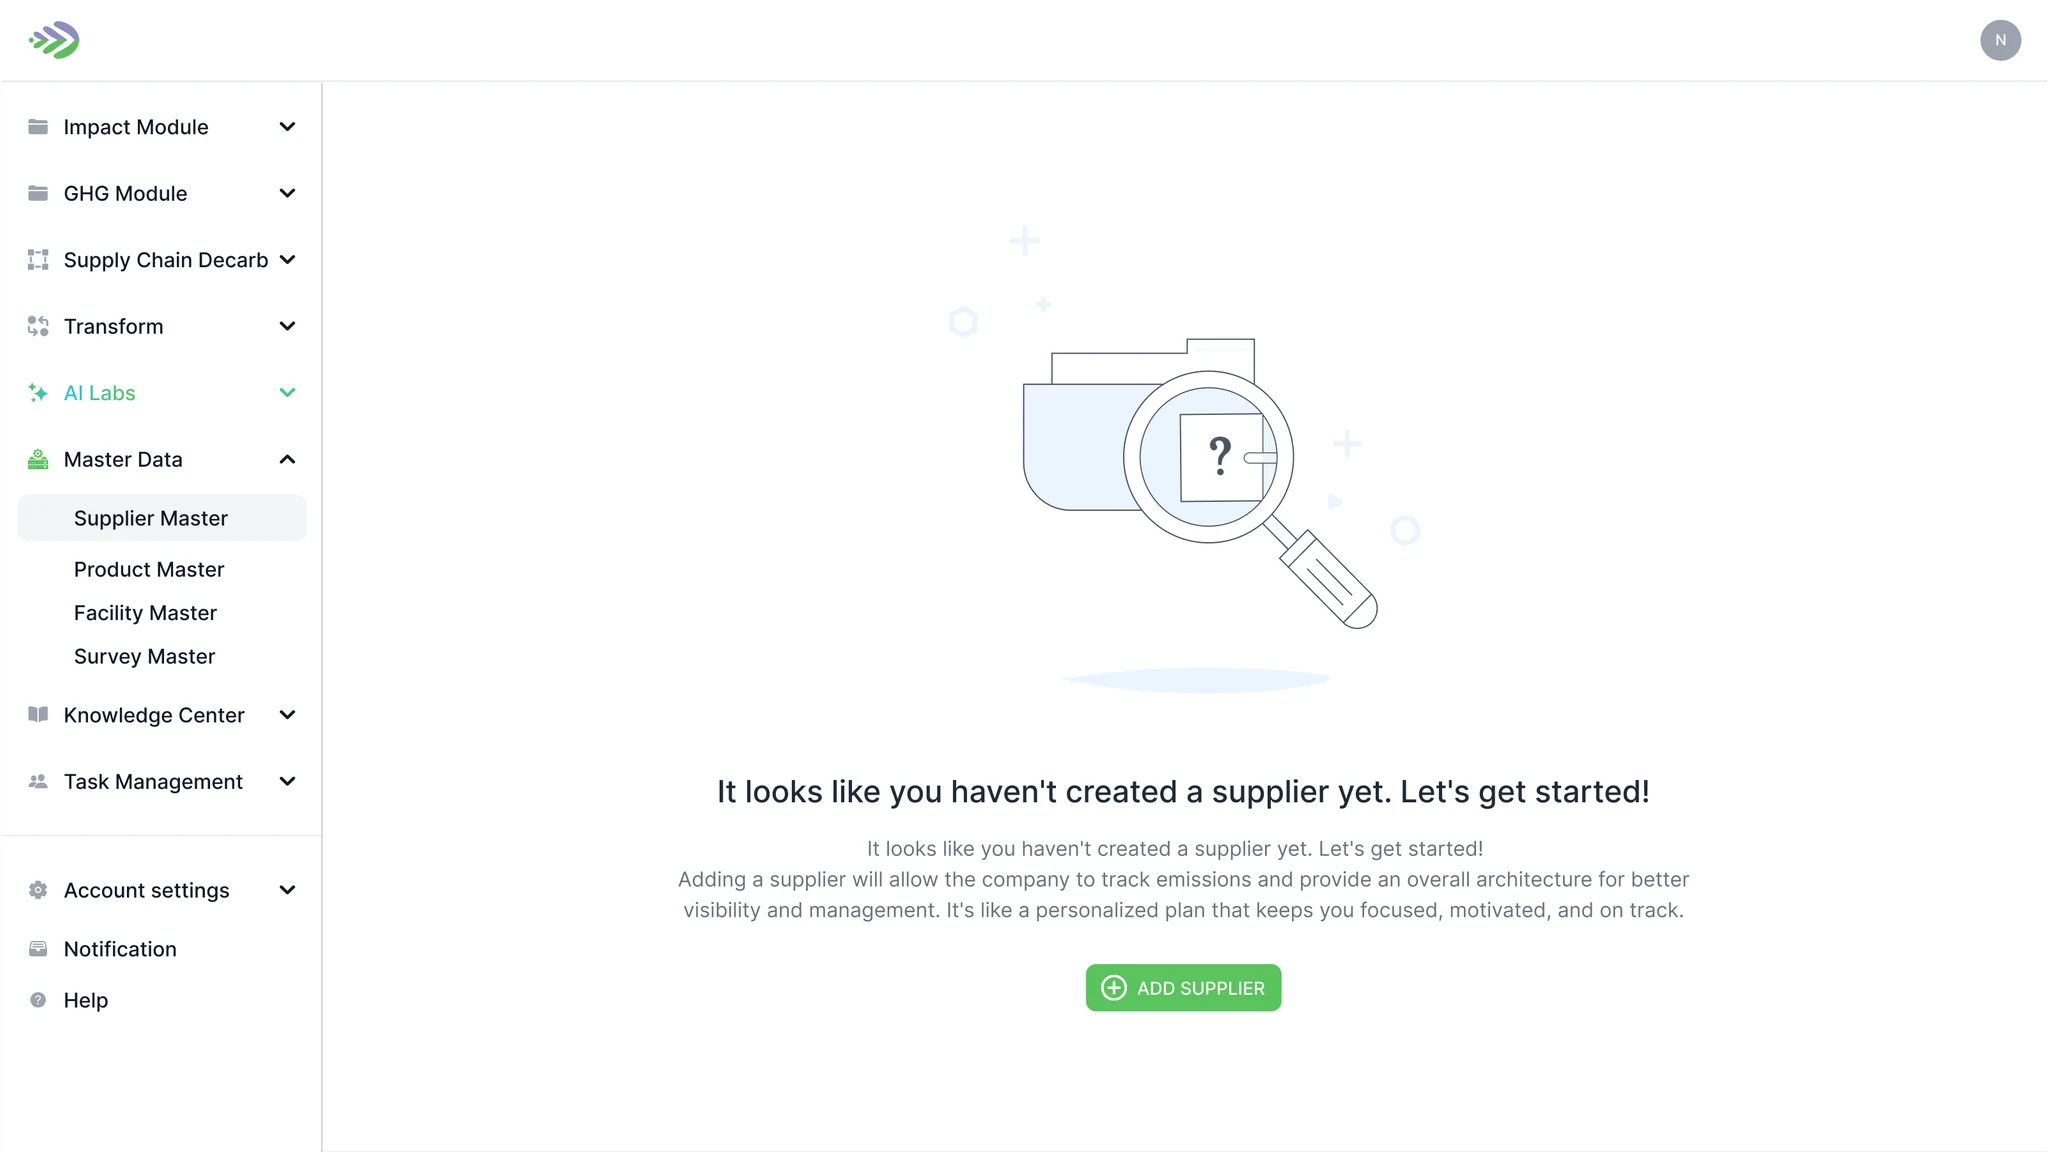
I designed a flow where the OEM onboards once, adds its suppliers (who add theirs), assigns ready-made surveys, and receives structured responses back, with every answer feeding one supplier dashboard.
The OEM sees each supplier's emissions, score, maturity level, and policy compliance, calculated from survey responses across every tier of its supply chain.
Bevolve's OEM clients need a Scope 3 number for frameworks such as BRSR, CDP and CSRD, and most of that number sits with their suppliers, and with their suppliers' suppliers. Before this module, supplier data arrived as questionnaires in each supplier's own format, chased one email at a time.
The brief was a module where the OEM brings its suppliers onto the platform, asks every tier the same questions, and sees the answers in one dashboard. I led the design of the OEM and supplier journeys and the supplier dashboard, with 1 designer and 2 developers, over 10 months.
As with GHG Accounting, I worked through Bevolve's sustainability consultants and product team, who run supplier engagement with OEM clients, to map how supplier data was collected and where it stalled.
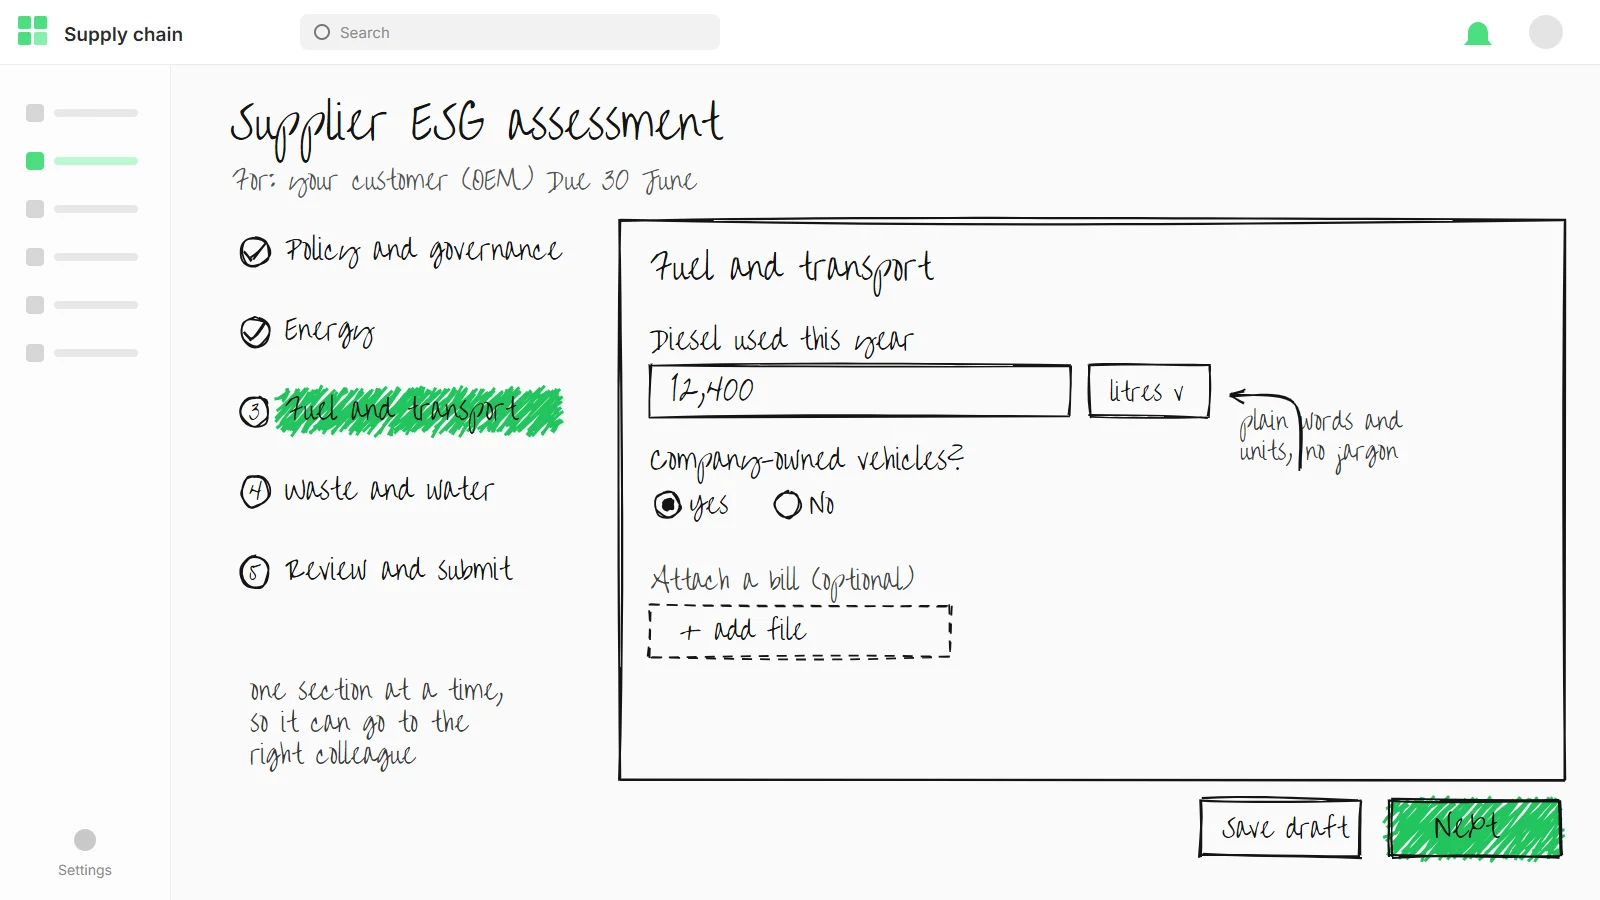
A supplier opens the module a few times a year, when a survey arrives. Every screen they see has to explain itself.
Relationships beyond the first tier sit with the suppliers themselves, so the OEM can't map the chain alone. Tier 1 has to be able to bring in tier 2.
Free-form replies can't be ranked or tracked. The same survey, scored the same way, is what turns replies into a Scope 3 view.
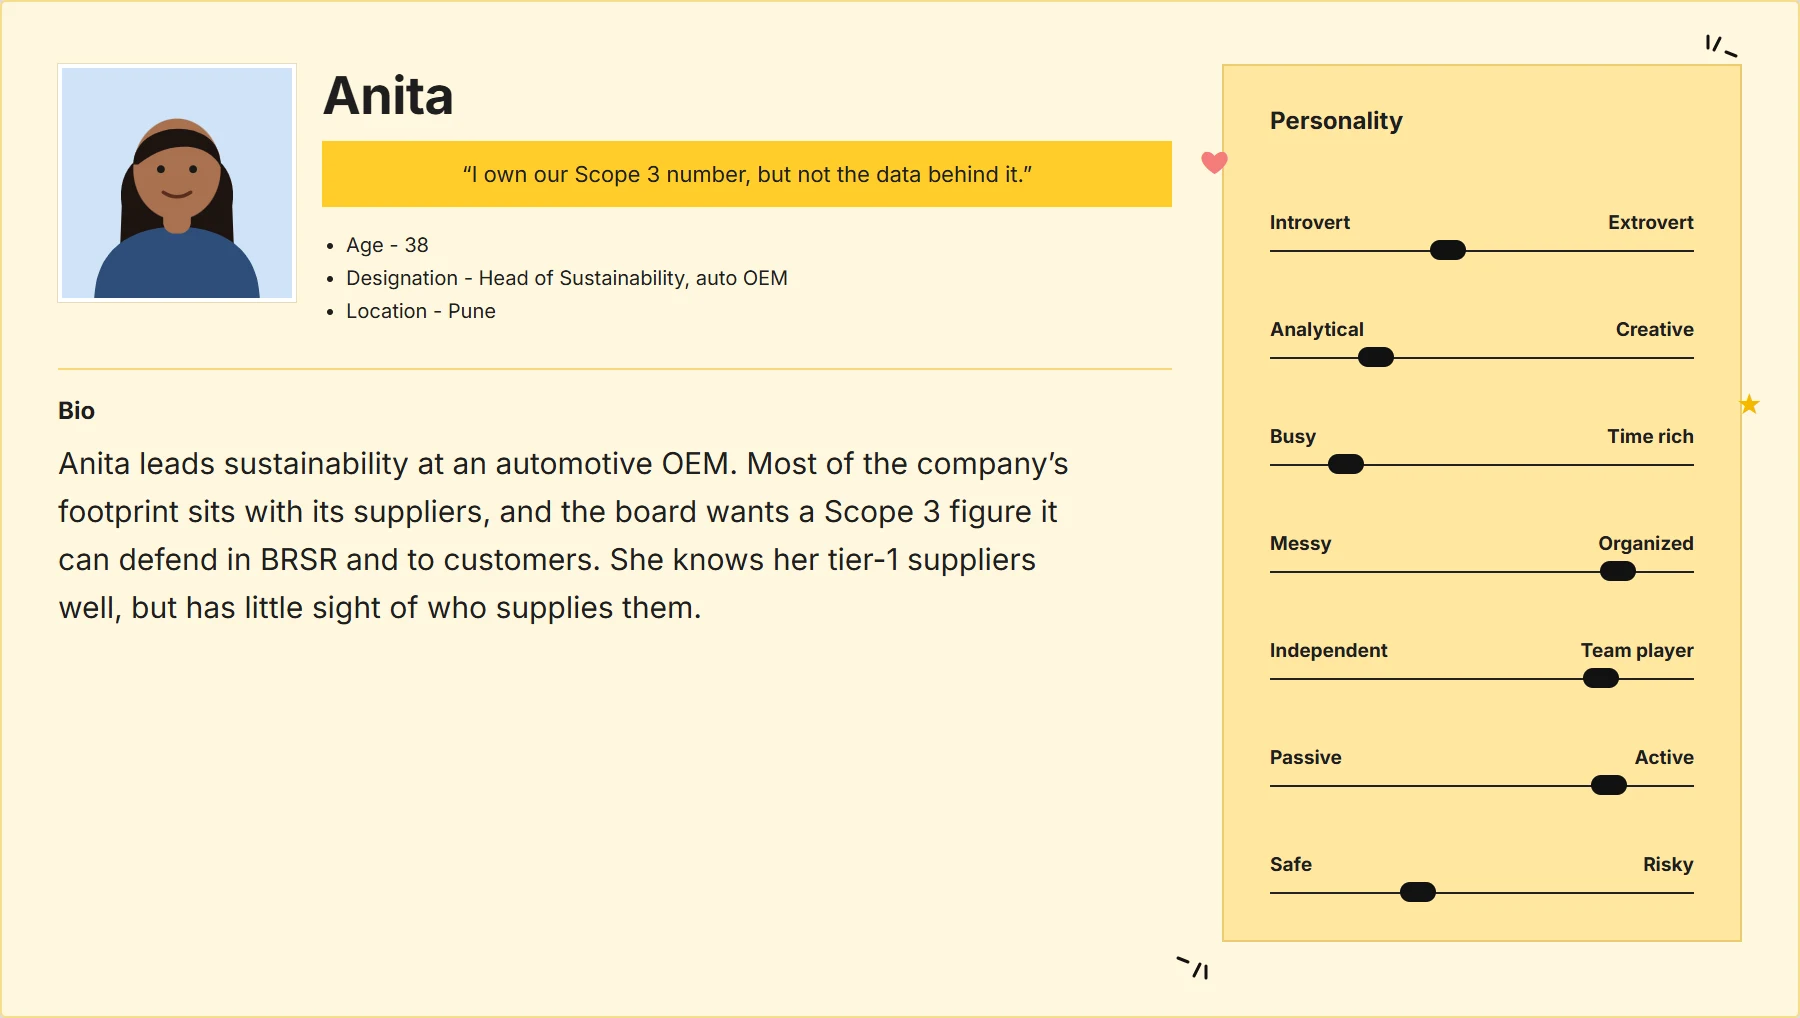
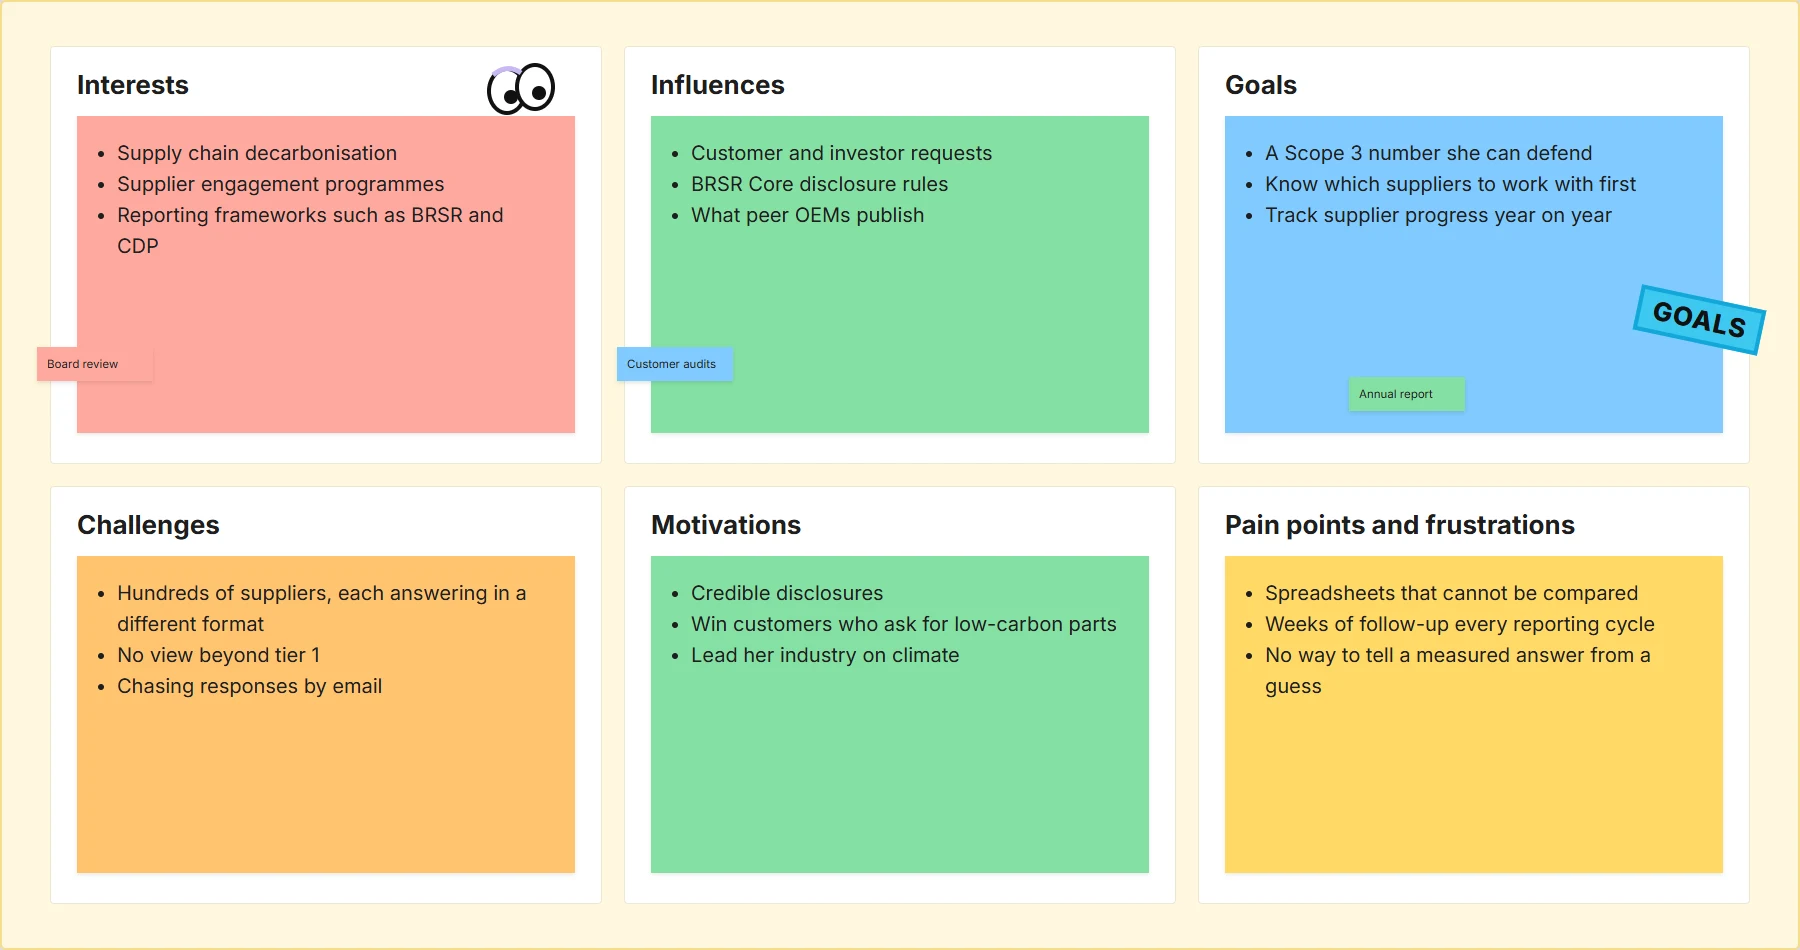
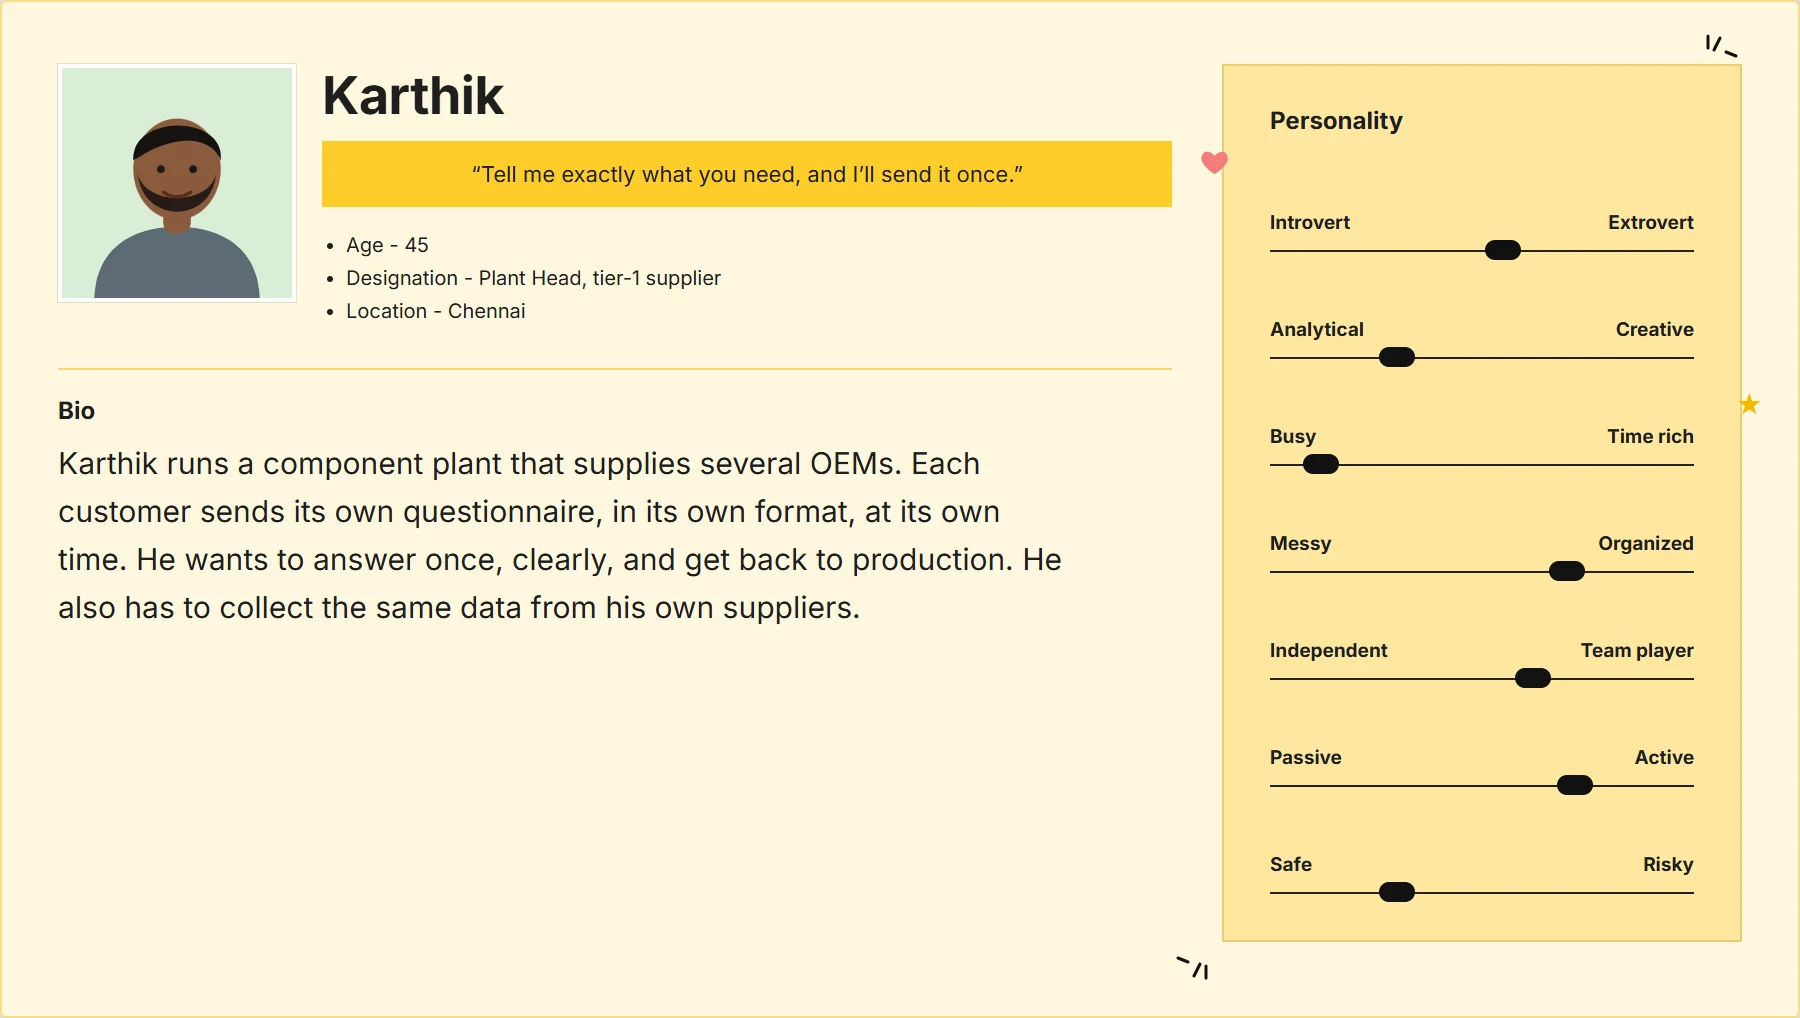
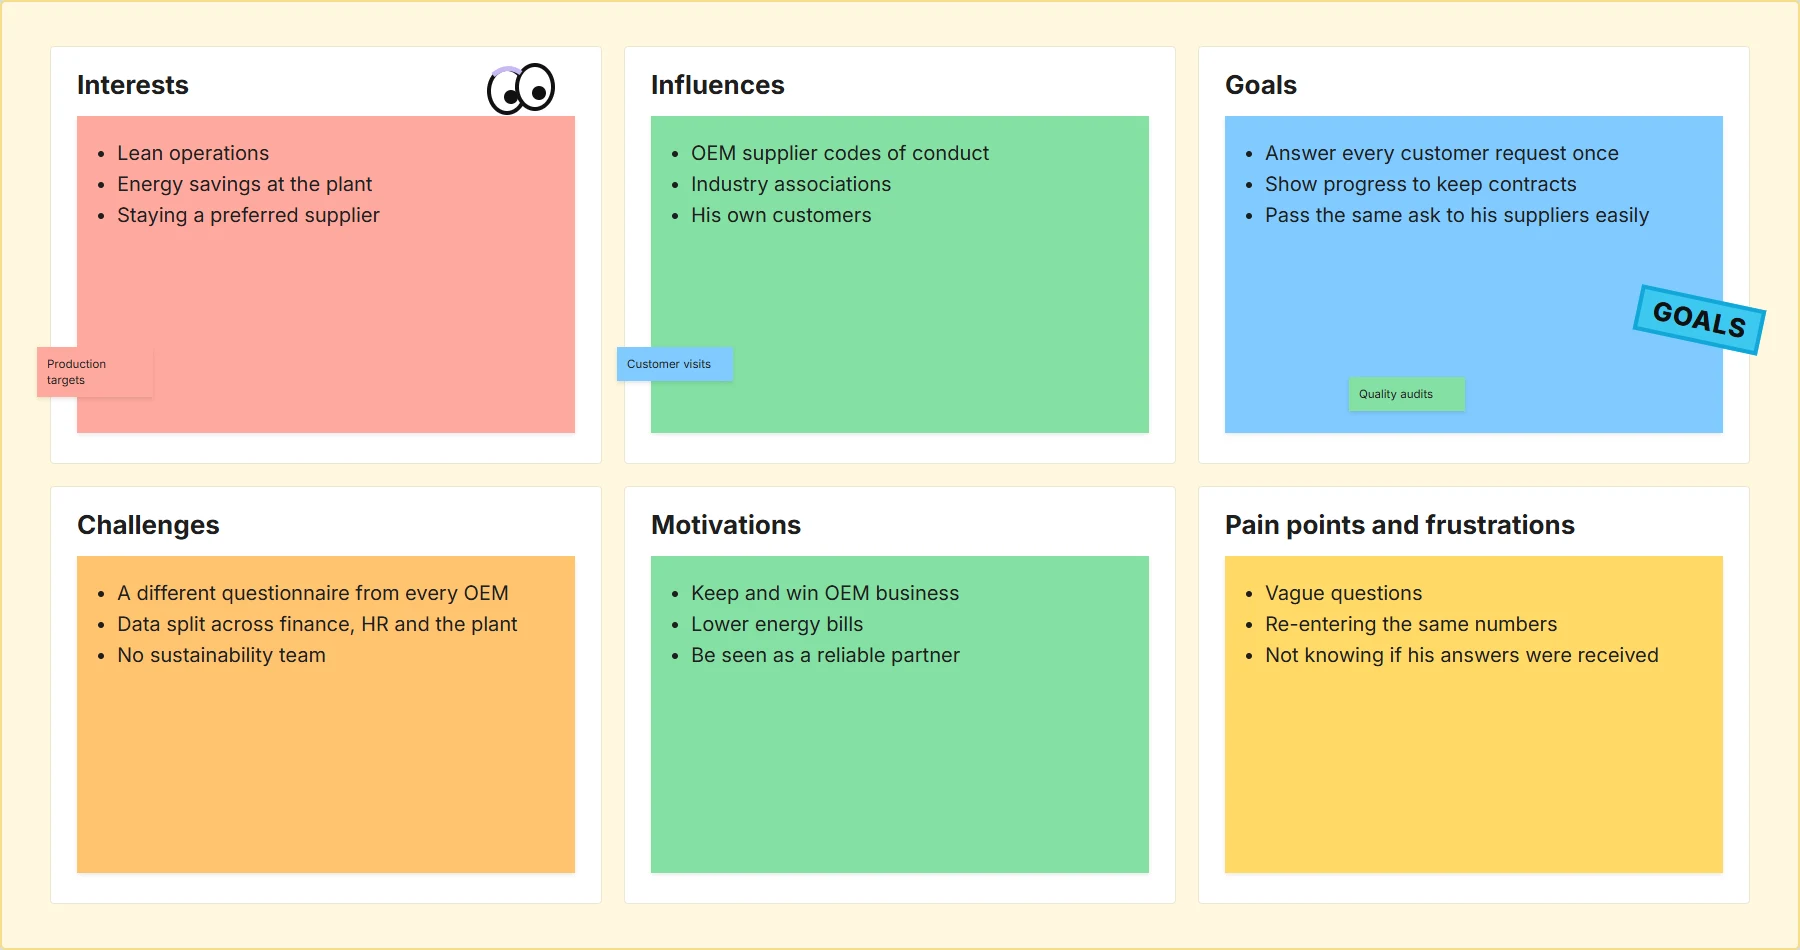
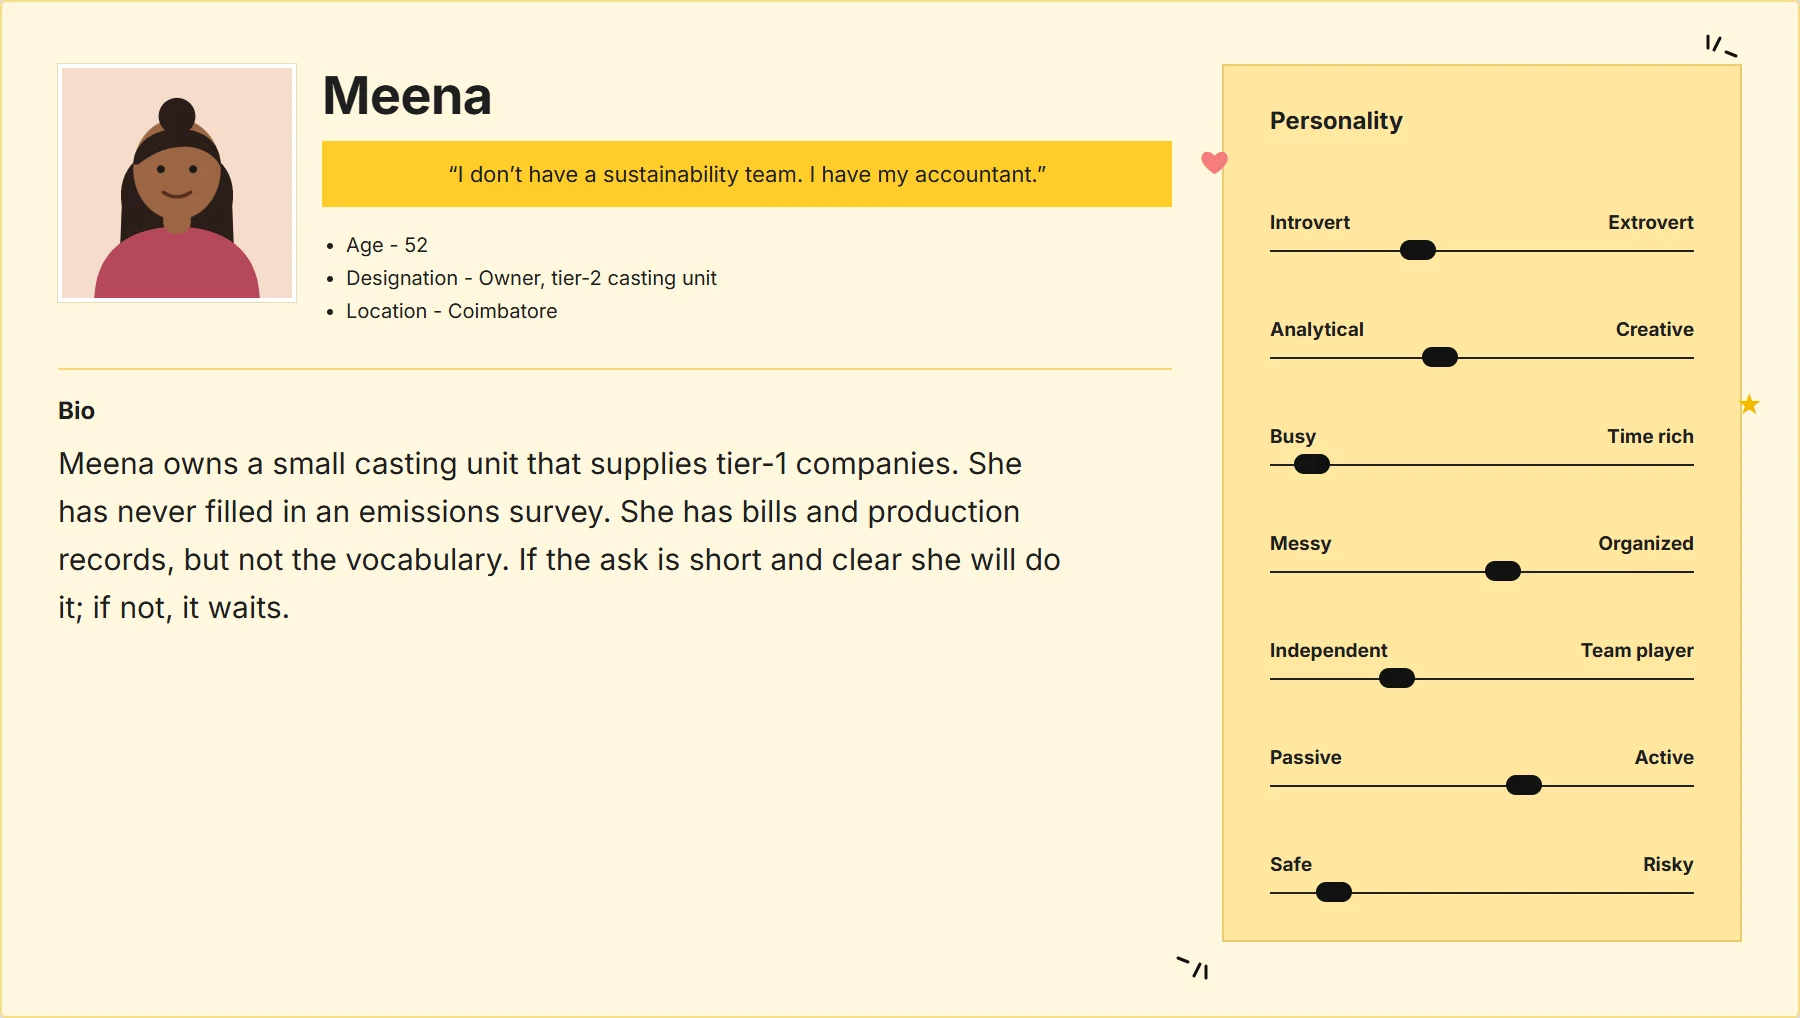
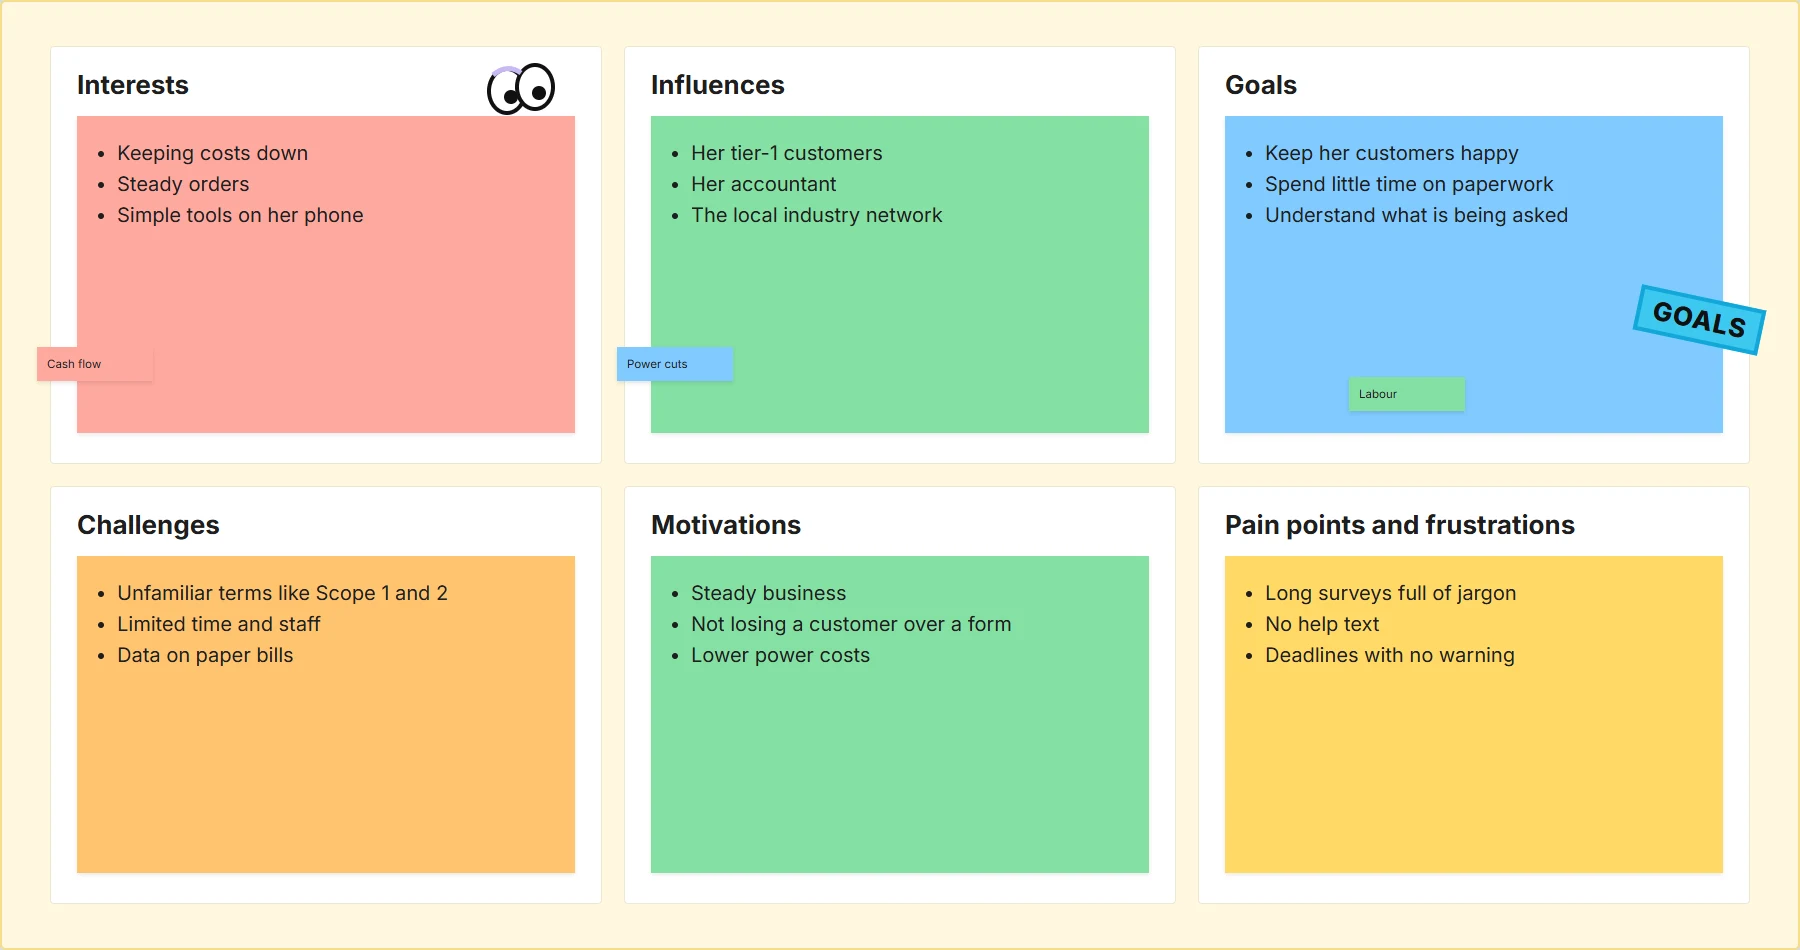
I built three personas in the same FigJam format as GHG Accounting: the OEM who asks, the tier-1 supplier who answers and passes the ask on, and the small tier-2 supplier with no sustainability team. They came from the consultants' accounts of real supplier programmes.
| Onboard | Map | Ask | Answer | See | |
|---|---|---|---|---|---|
| Doing | The OEM lists the suppliers it buys from | Suppliers name the suppliers they buy from | The OEM sends a questionnaire on emissions and policy | Suppliers fill it in and send it back | The OEM rolls the answers into its Scope 3 |
| Pain | Supplier lists live in procurement spreadsheets | Nobody has the full chain beyond tier 1 | Every OEM sends a different format | Long, jargon-heavy forms; small suppliers stall | Answers can't be compared or tracked year on year |
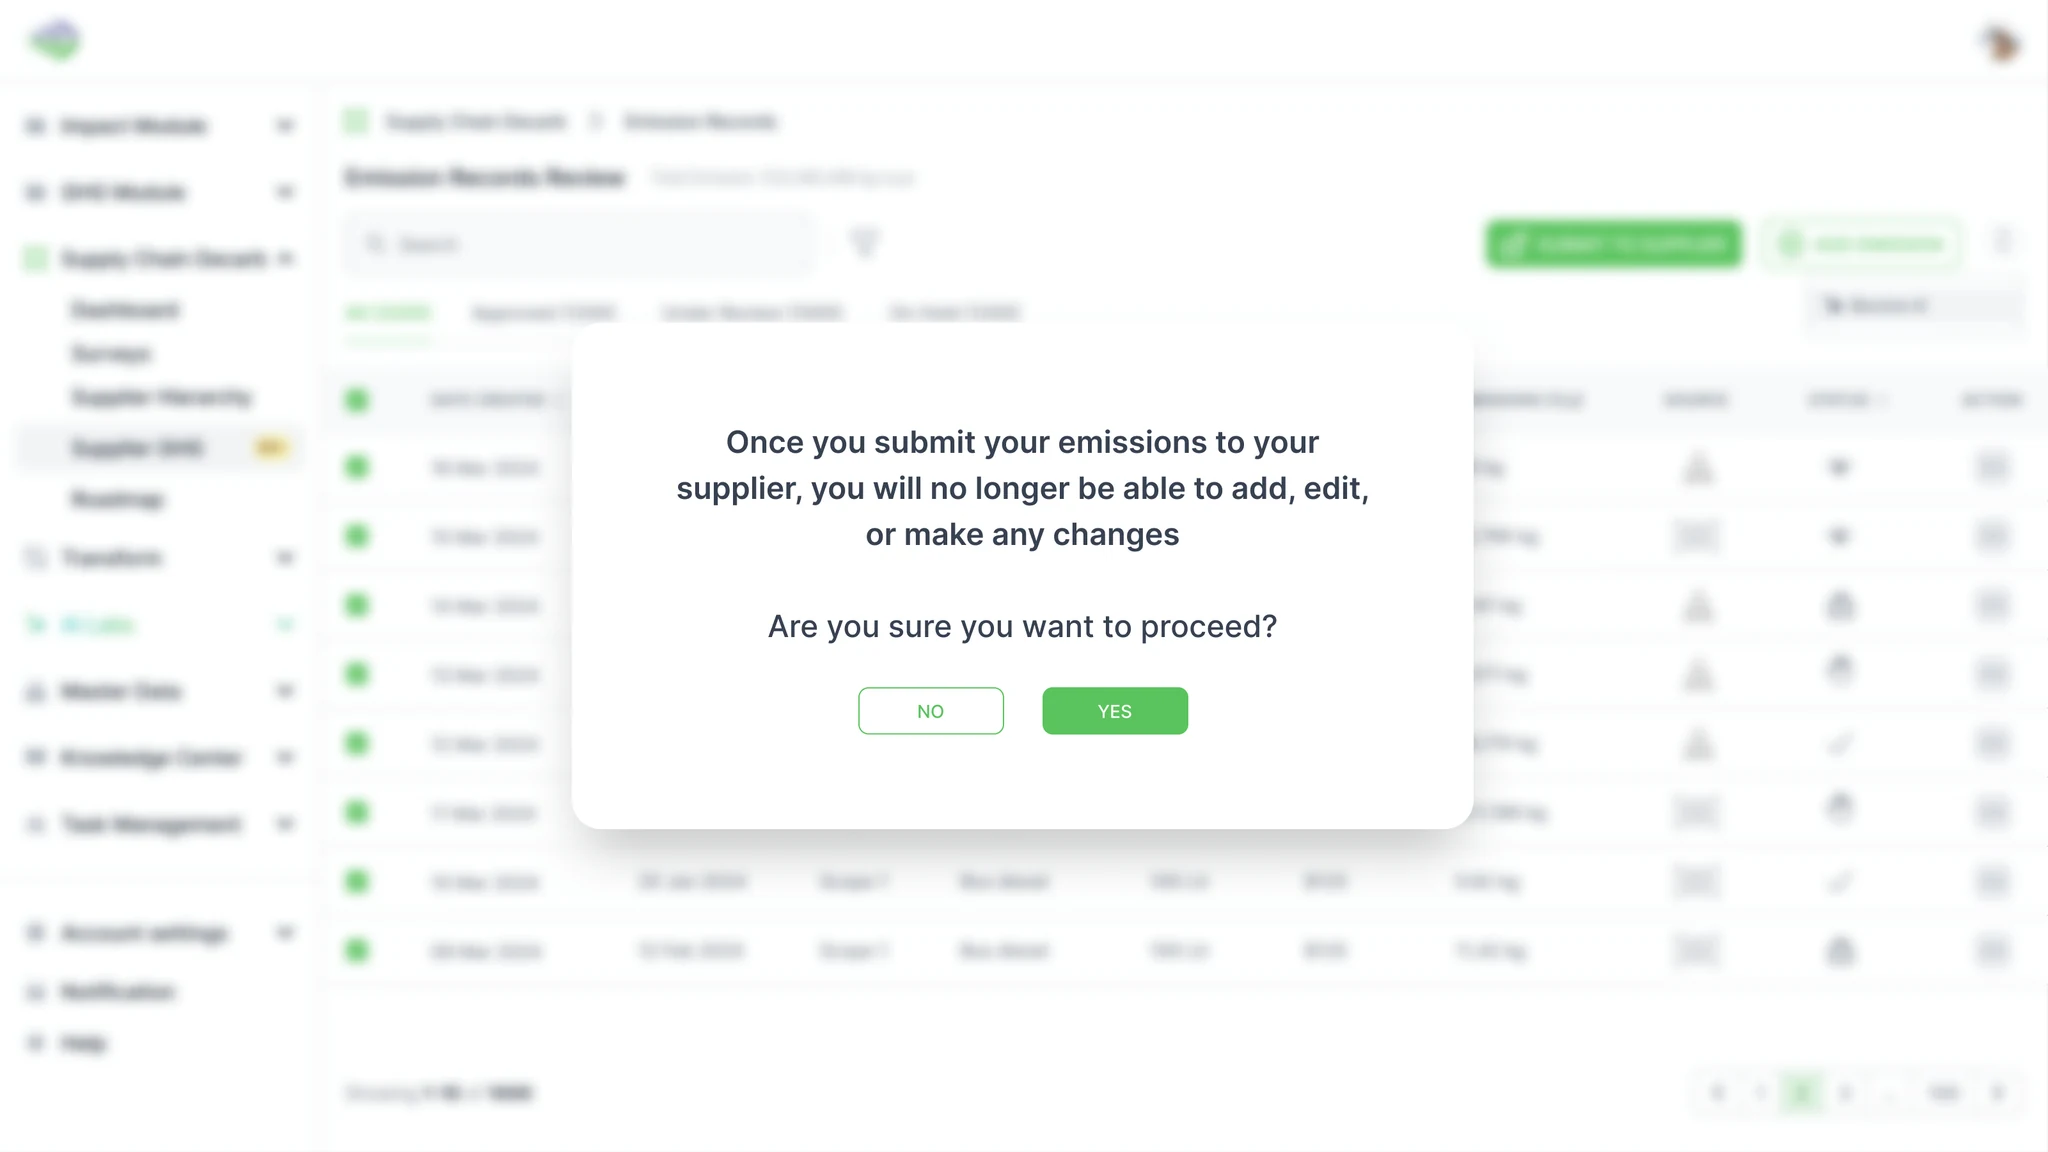
| Design response | A supplier master, with a clear first step when it's empty | Tier 1 invites tier 2, shown as one hierarchy | Ready-made survey templates, previewed before sending | One section at a time, in plain words, with a submit confirmation | Every response scored and levelled on one dashboard |
The first ask was a way to gather supplier emissions. The real problem was structure: who is in the chain, what they are asked, and how their answers compare.
How might we get every tier of a supply chain to answer the same questions, without the OEM chasing each supplier, and turn those answers into a Scope 3 view it can act on?
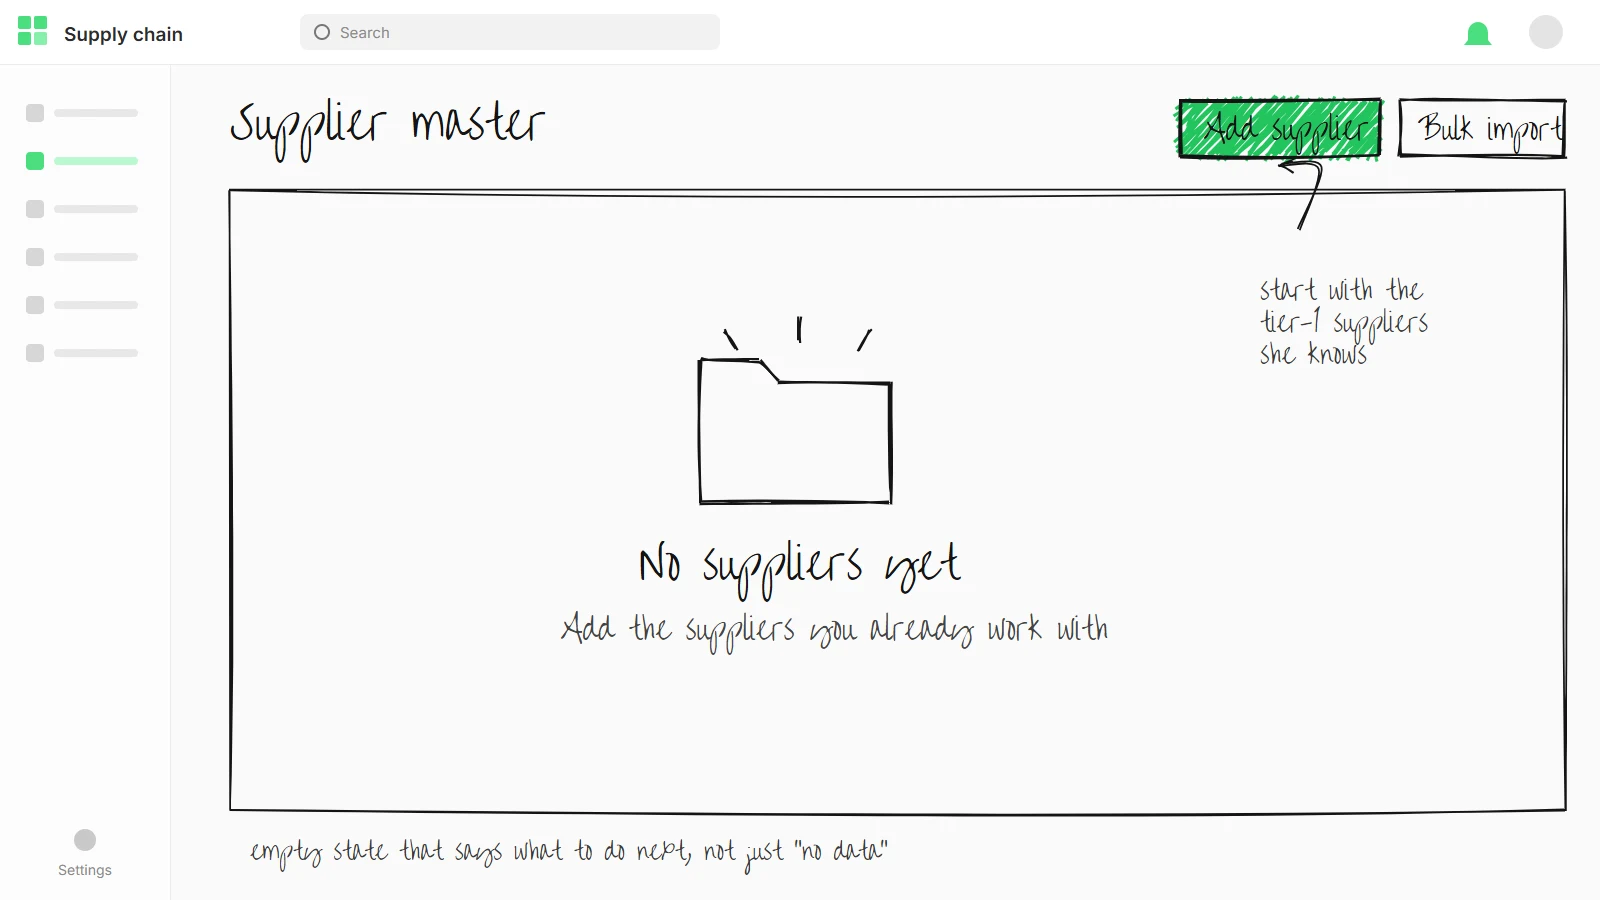
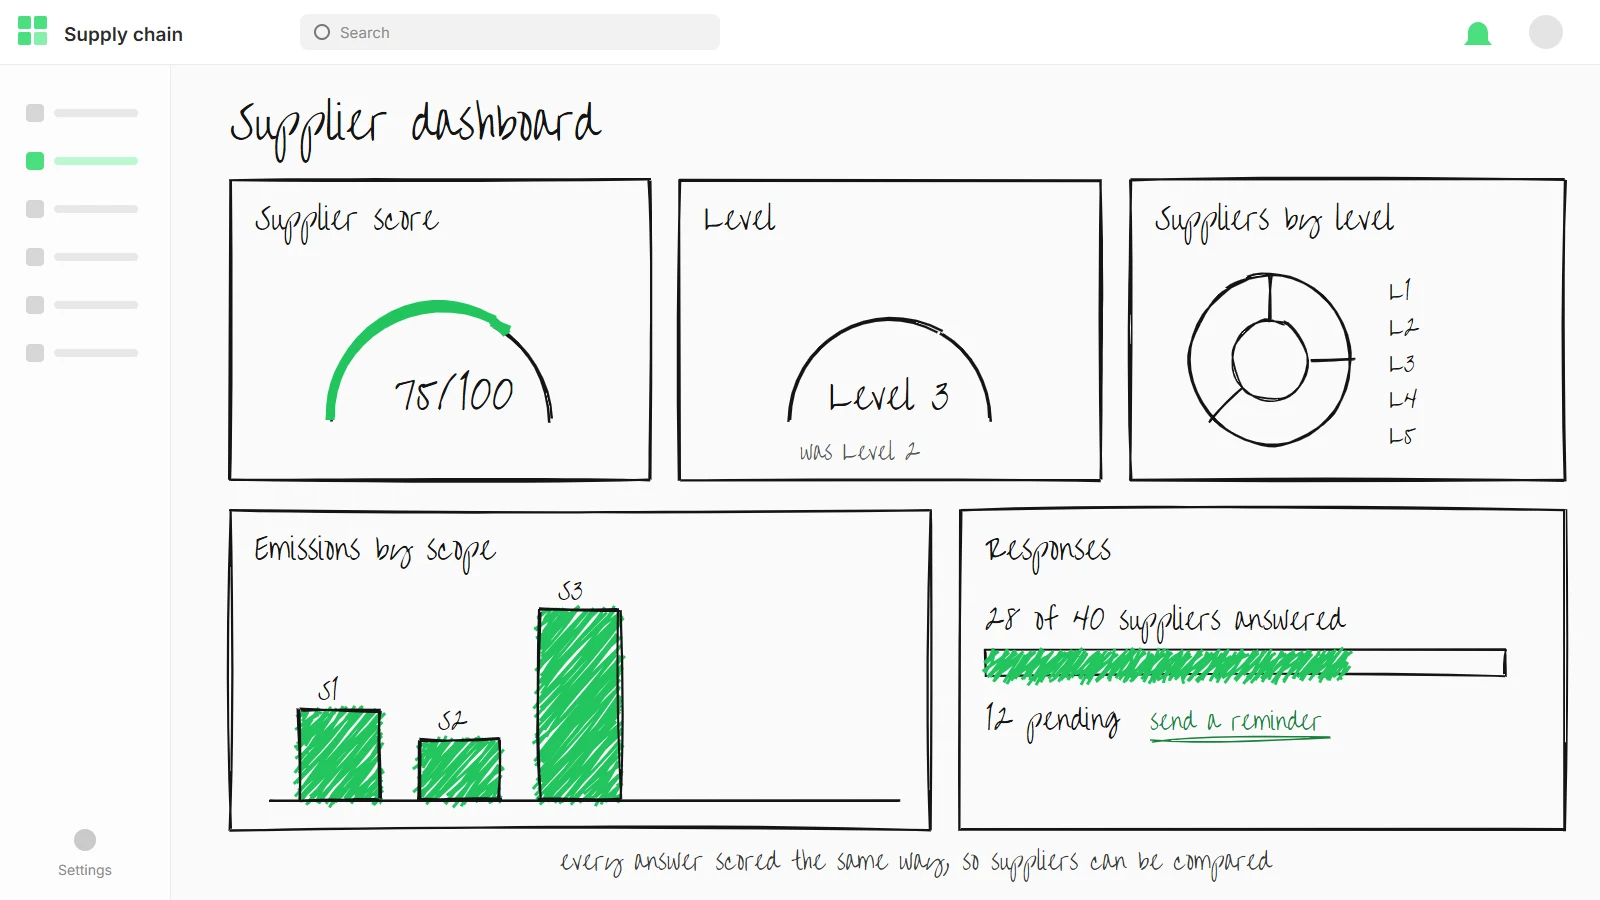
I sketched the OEM and supplier screens before opening Figma. The notes in the margins are the job of each screen. Some ideas, like bulk import and reminders, were parked for later; the flow itself carried straight into the final design.
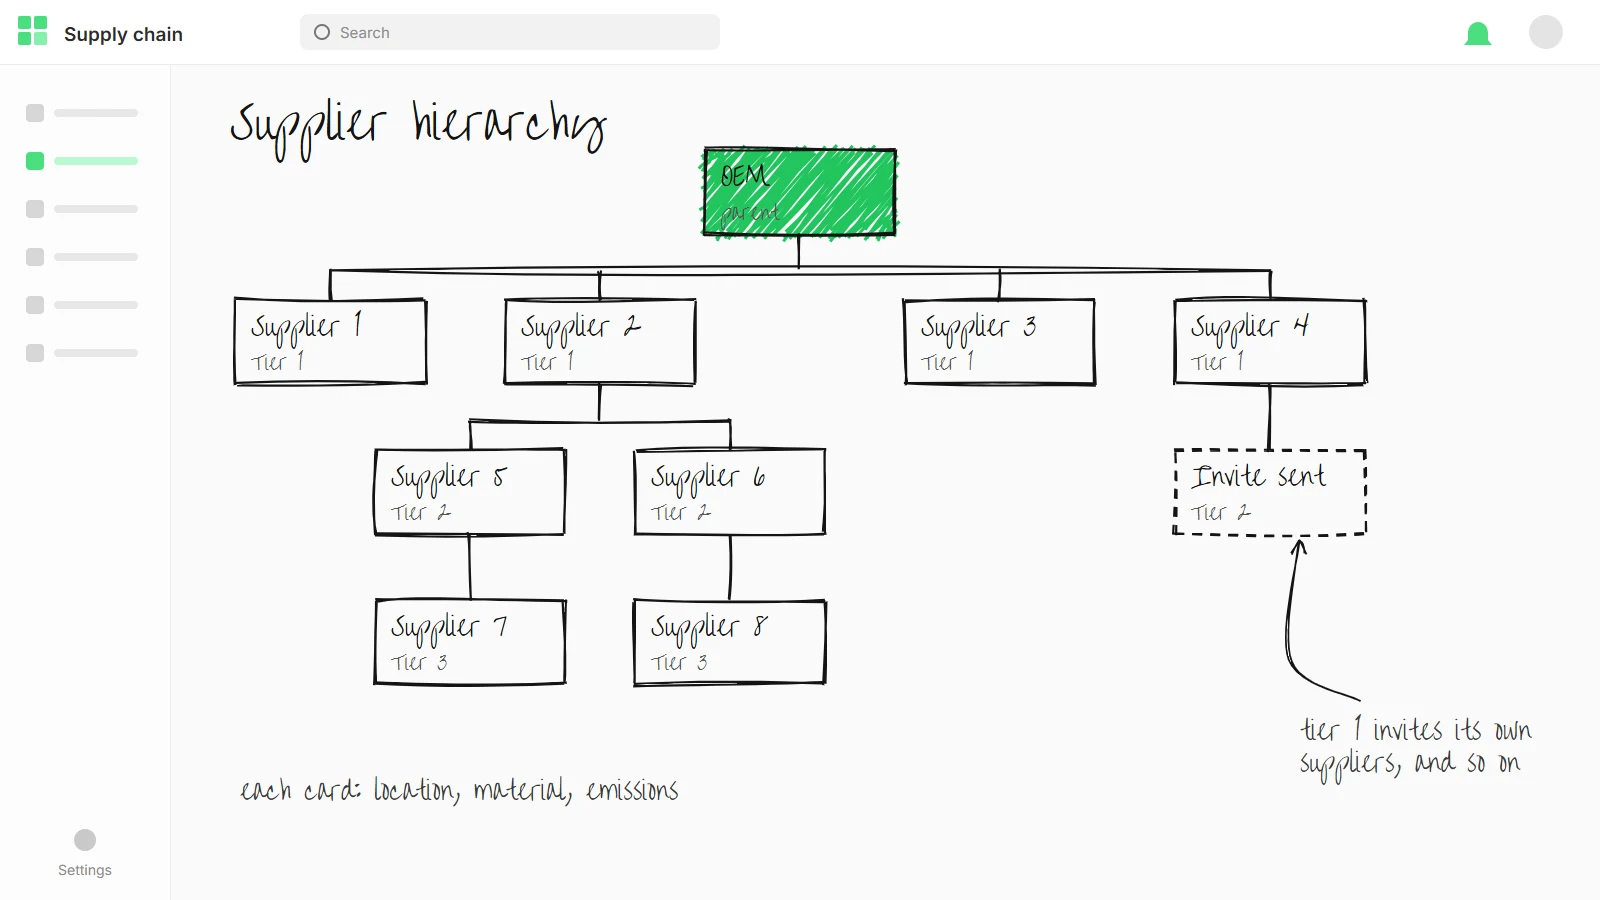
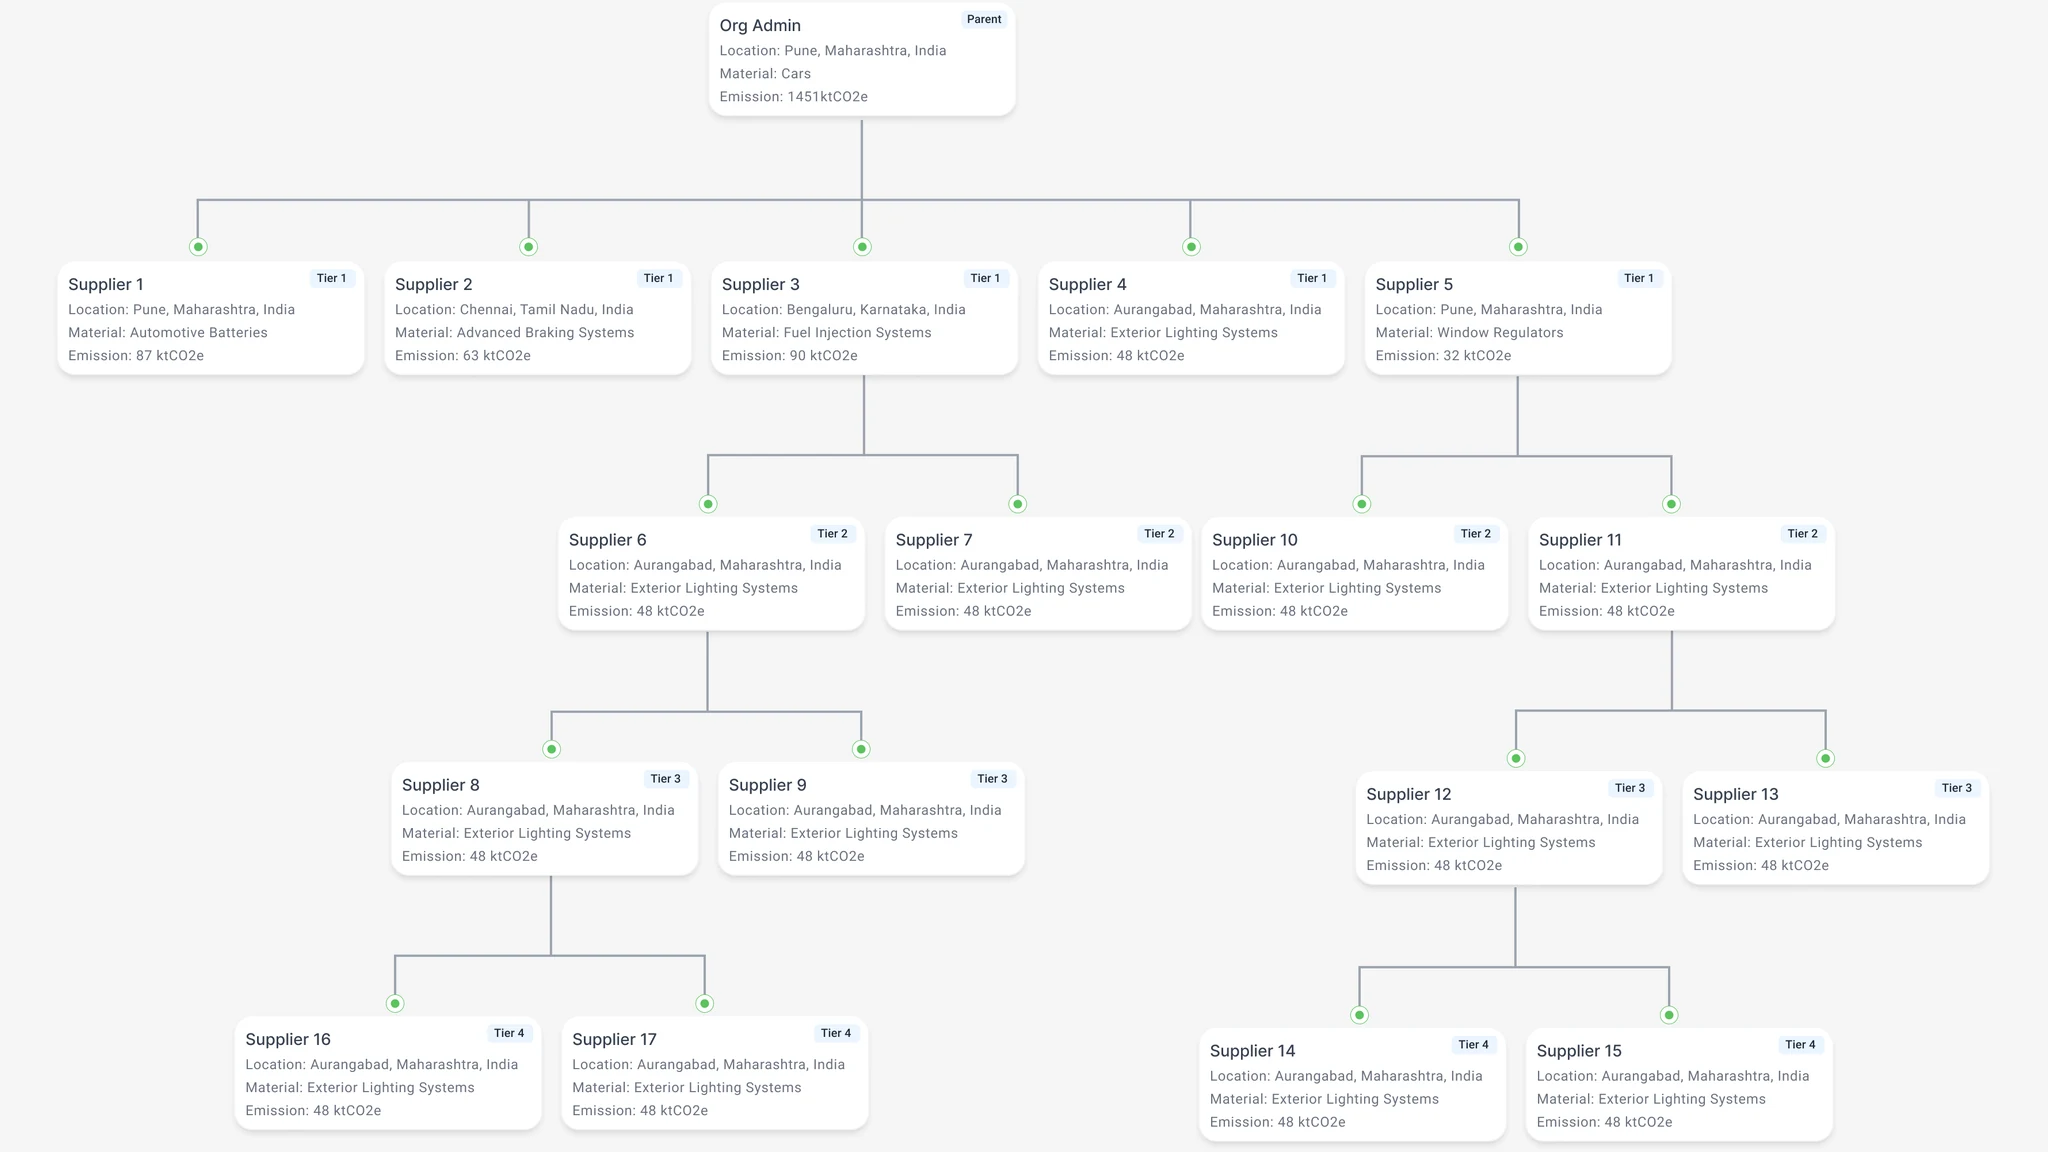
The OEM can't see past tier 1, so the design lets each supplier add its own suppliers. The result is one hierarchy, from the OEM down to tier 4, with location, material and emissions on every card.
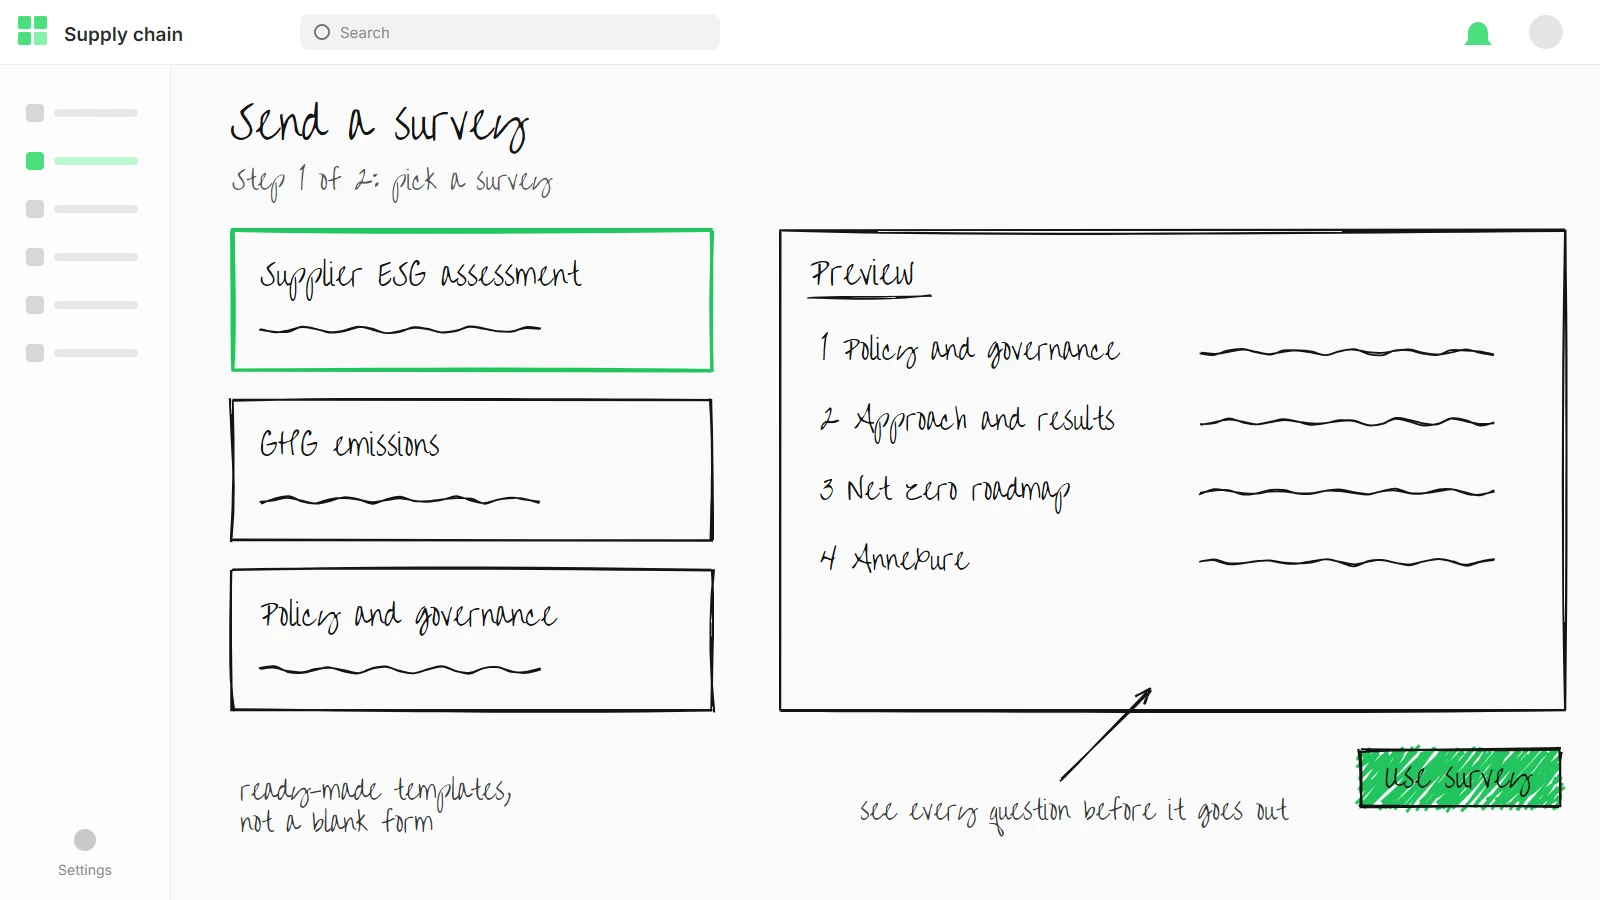
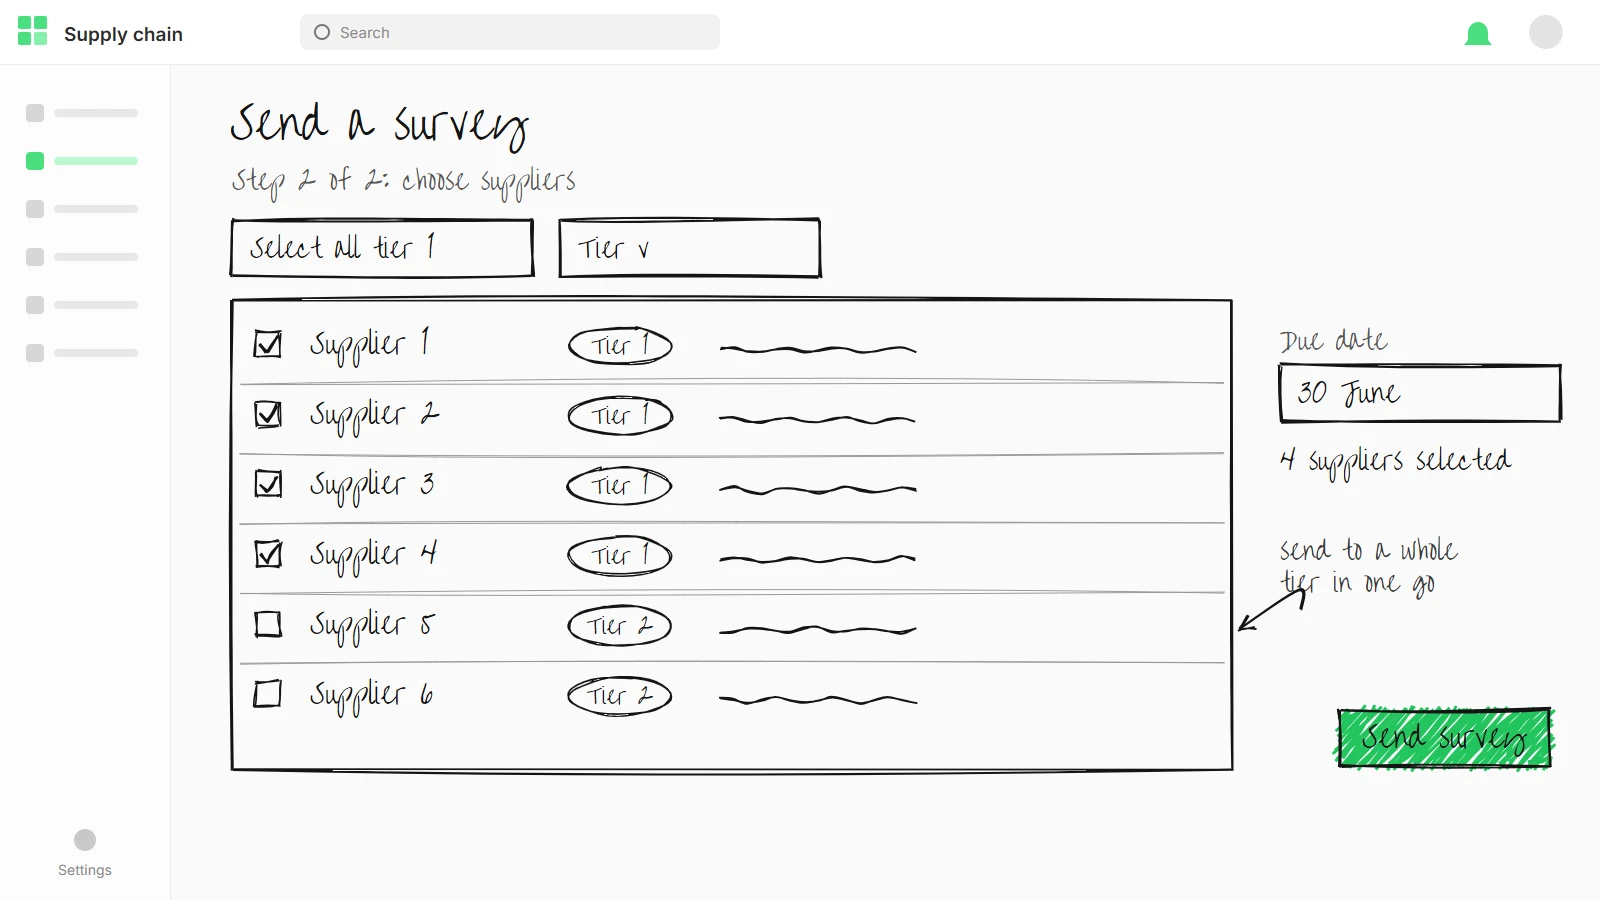
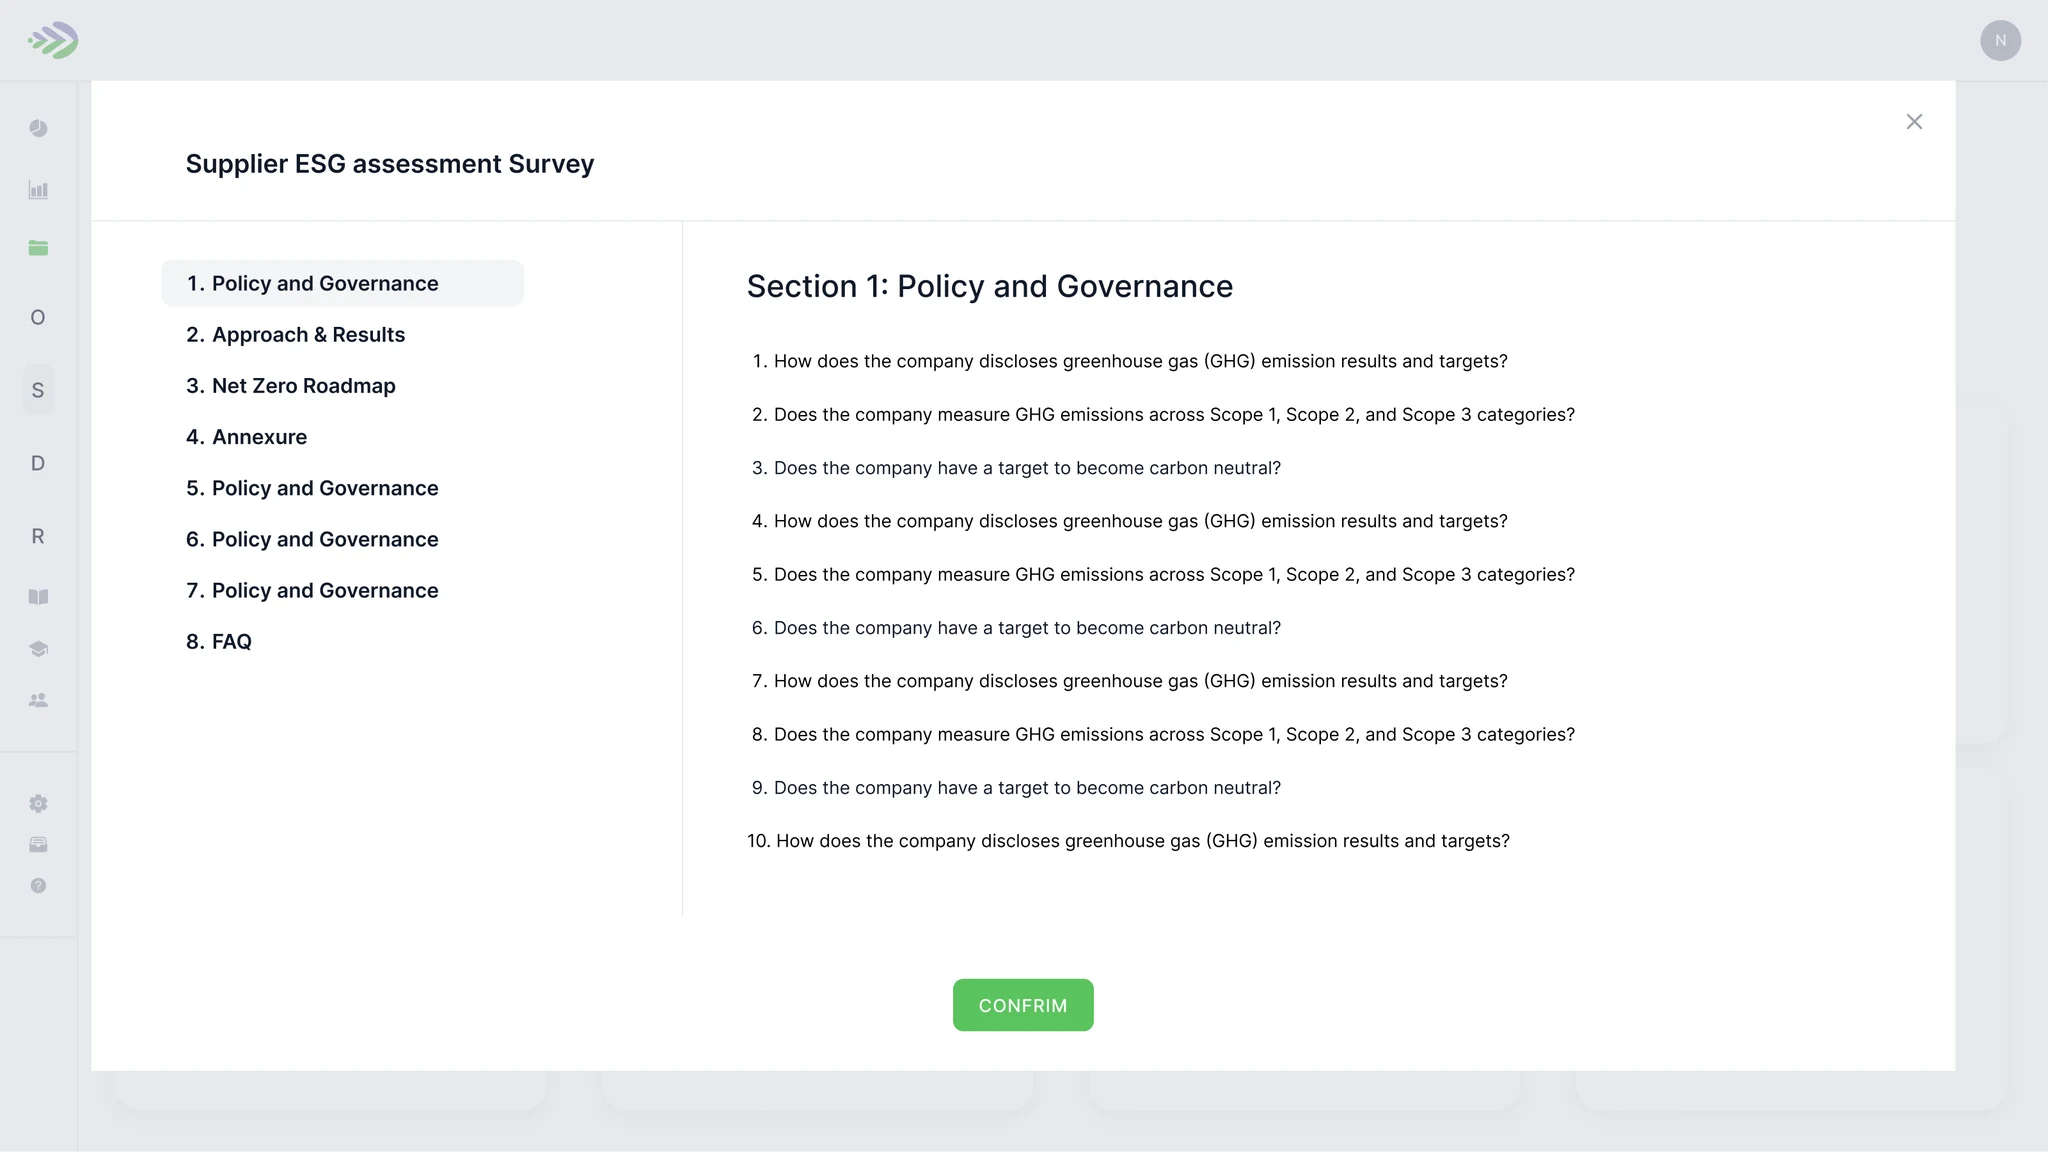
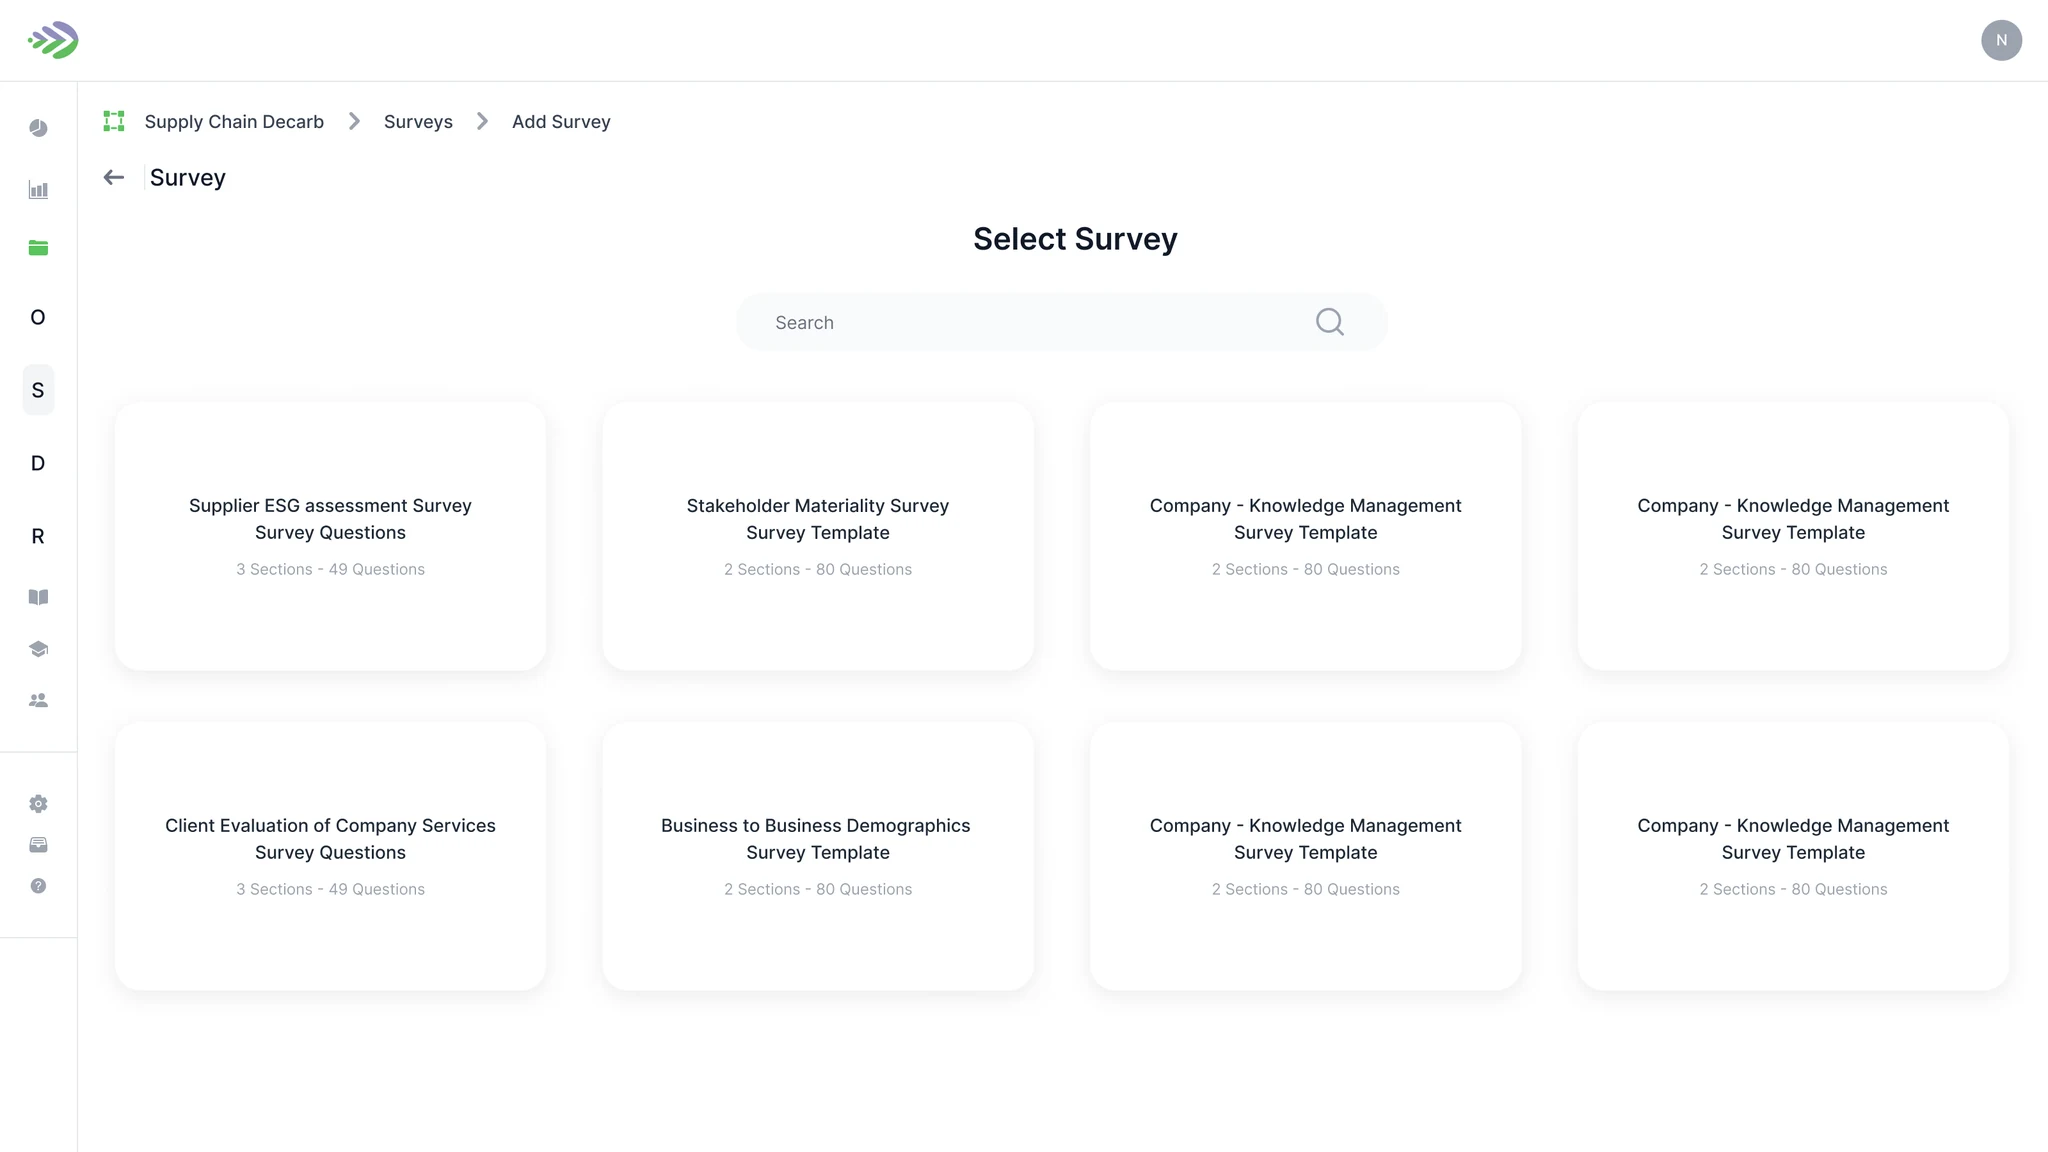
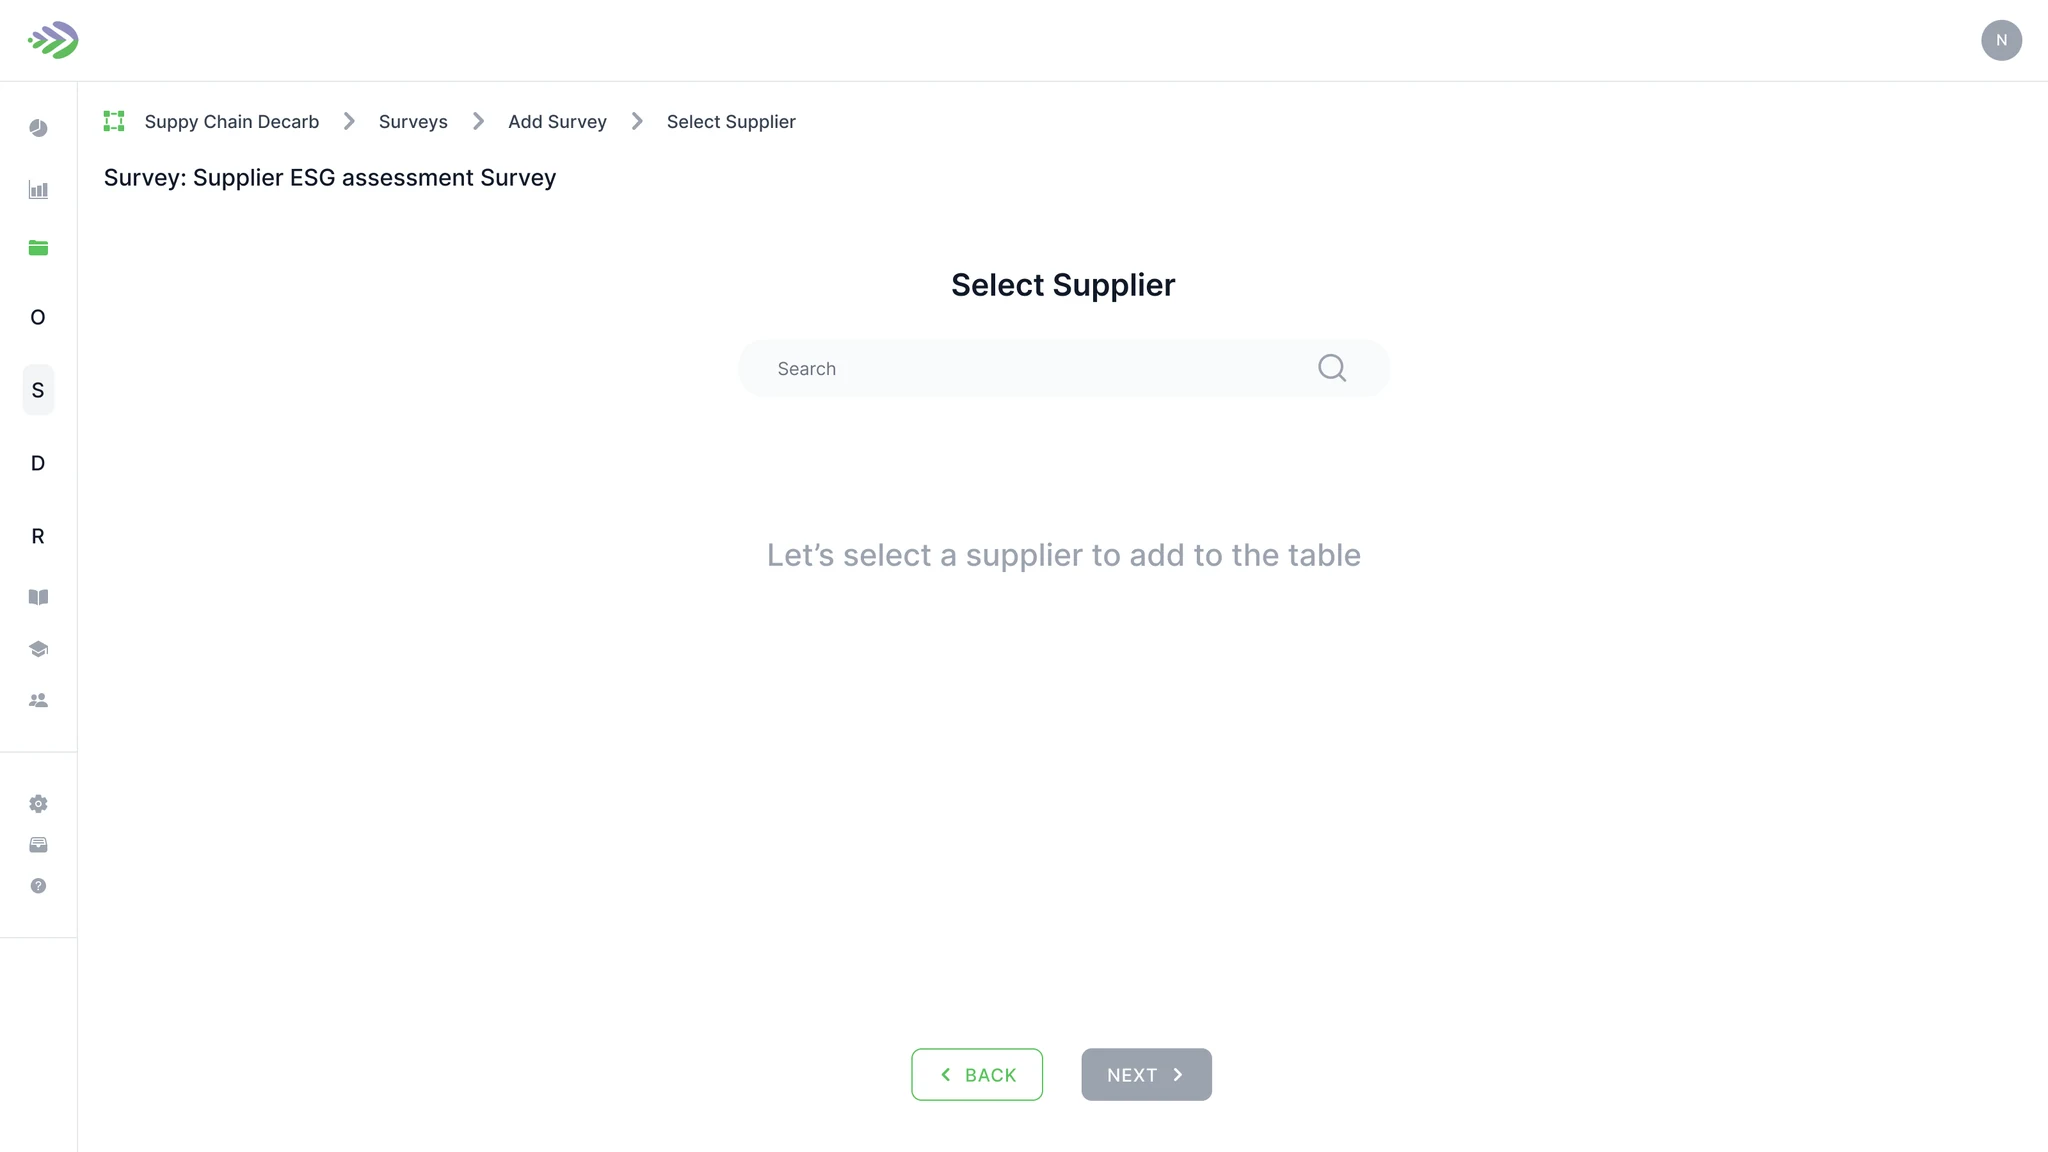
The OEM picks a ready-made survey, such as the Supplier ESG assessment, and previews every section before it goes out. Every supplier gets the same questions in the same order, which is what makes their answers comparable.
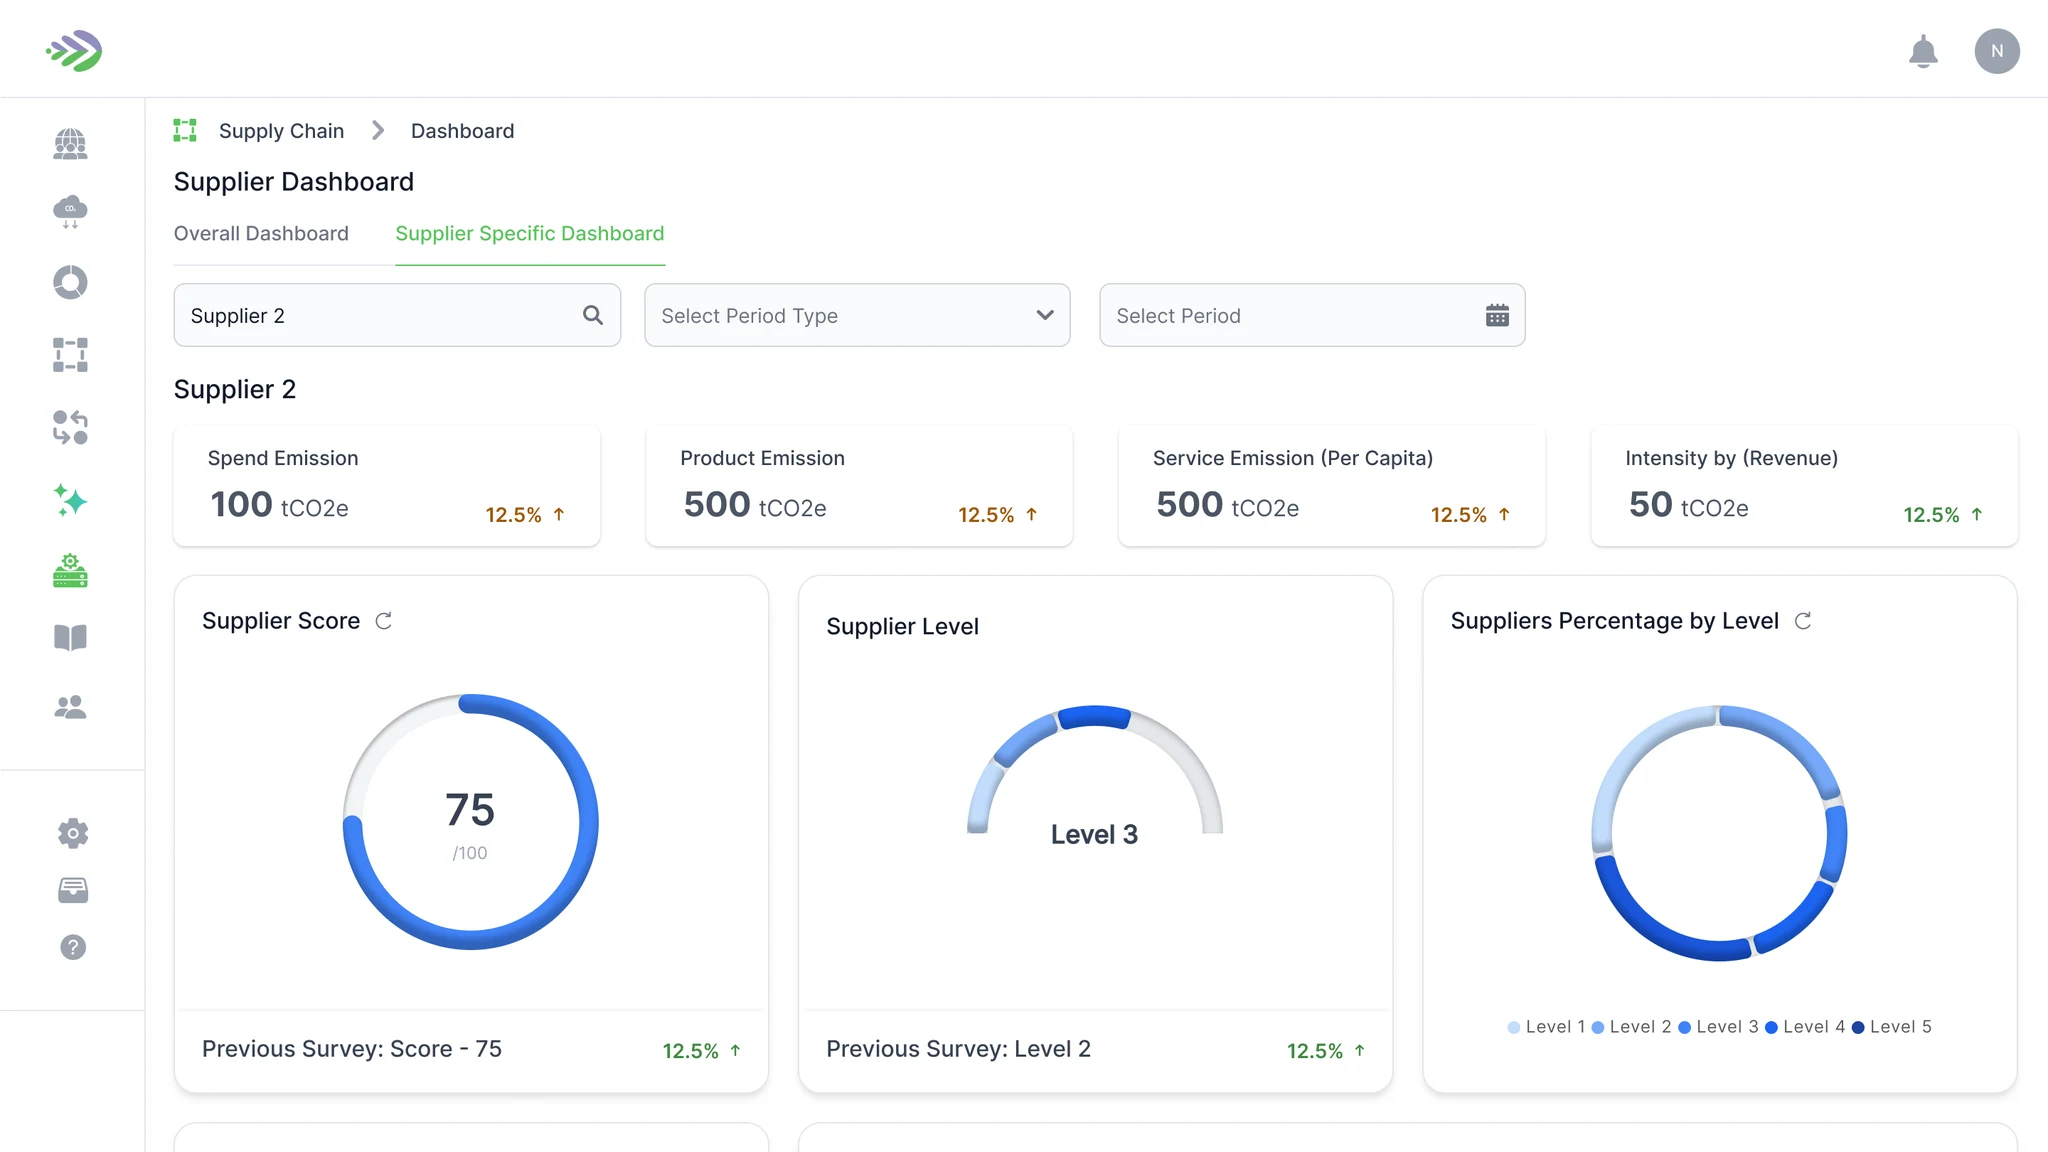
Each response becomes a score out of 100 and a maturity level from 1 to 5, shown against the previous survey. The OEM can rank suppliers, see who is improving and decide where to start.
I owned the OEM journey and the dashboard, and the second designer took the supplier response flow, reviewed together each week against the Bevolve design system. I wrote the requirements with product and engineering, and ran design QA on each build before release.
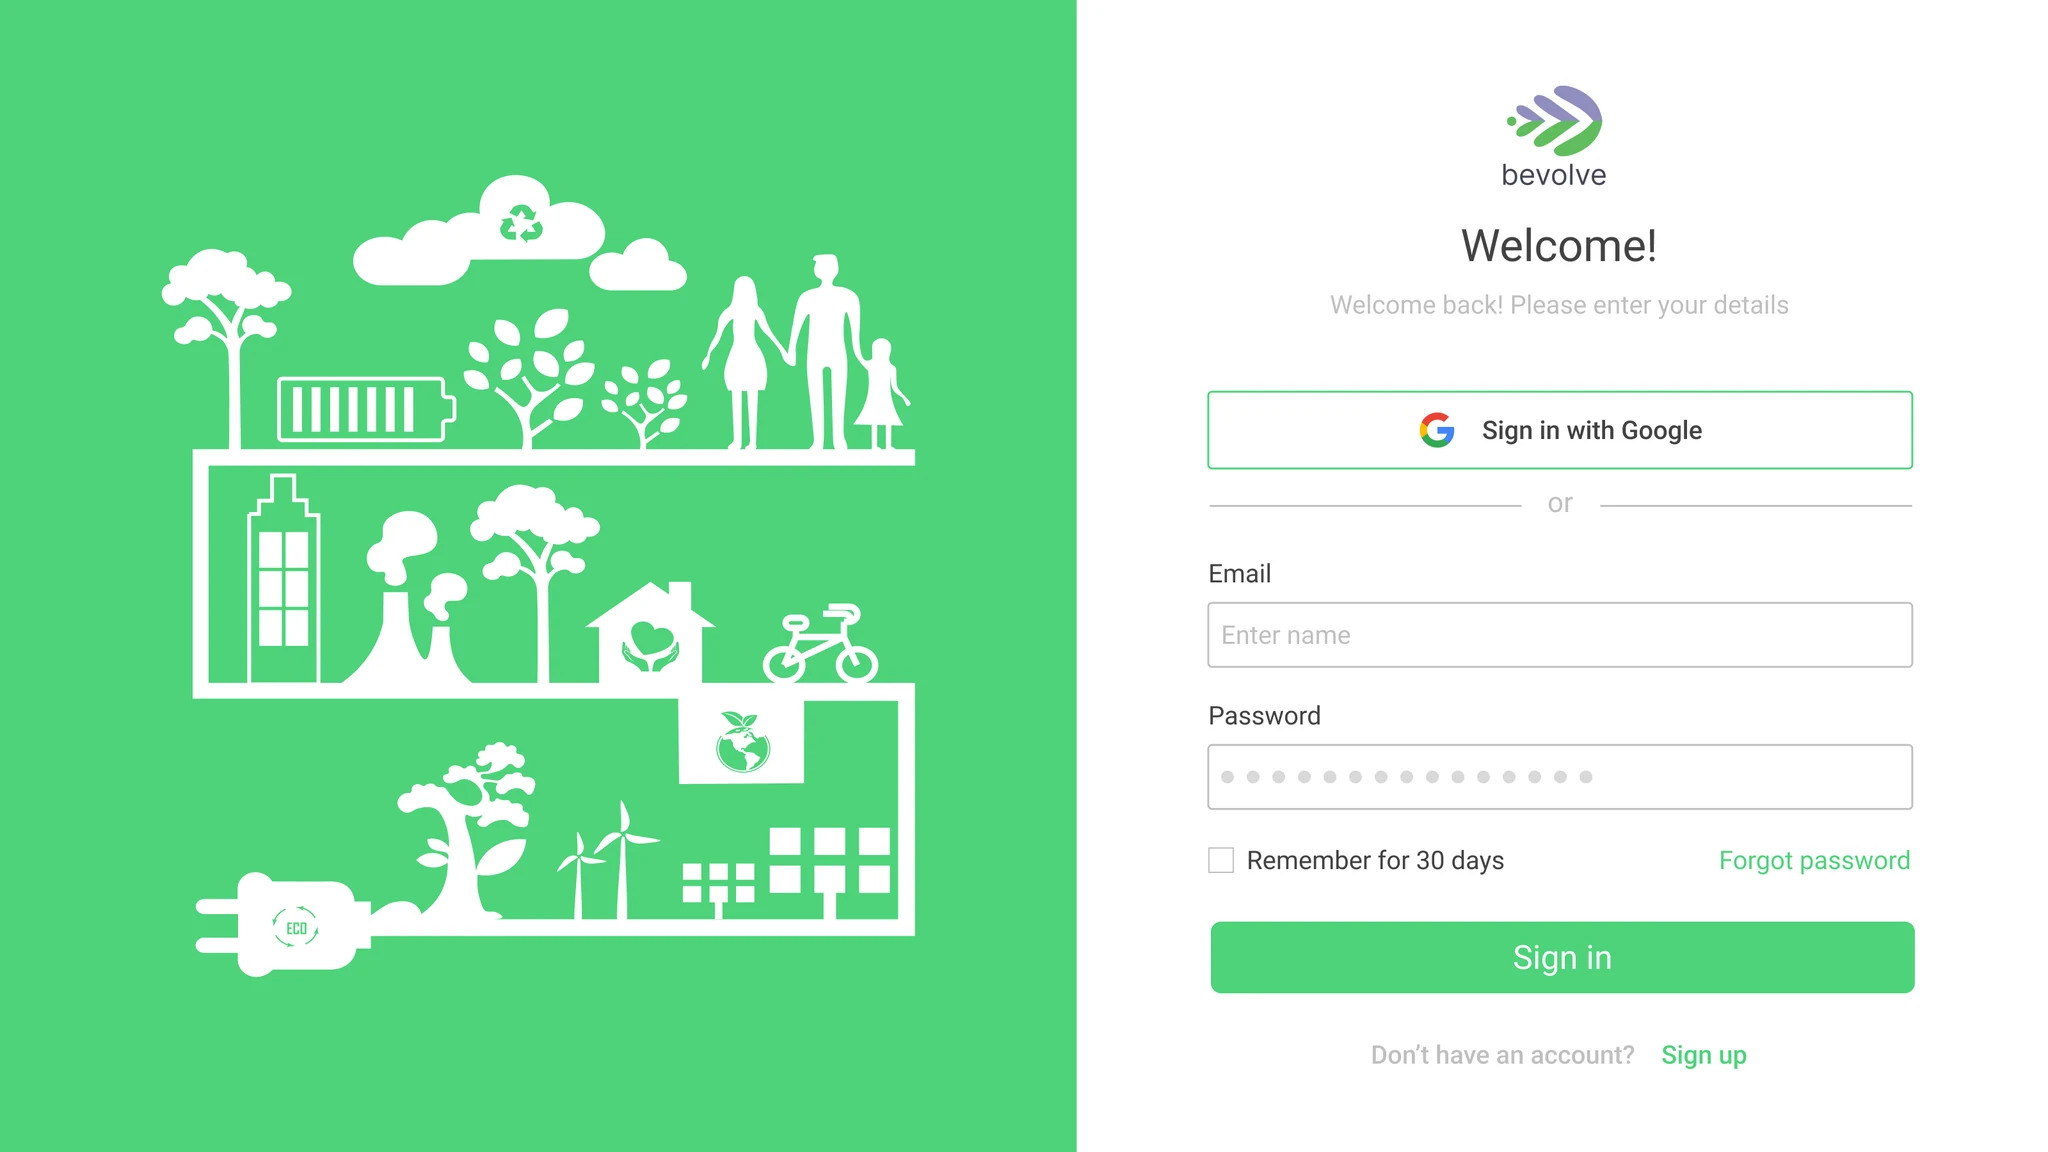
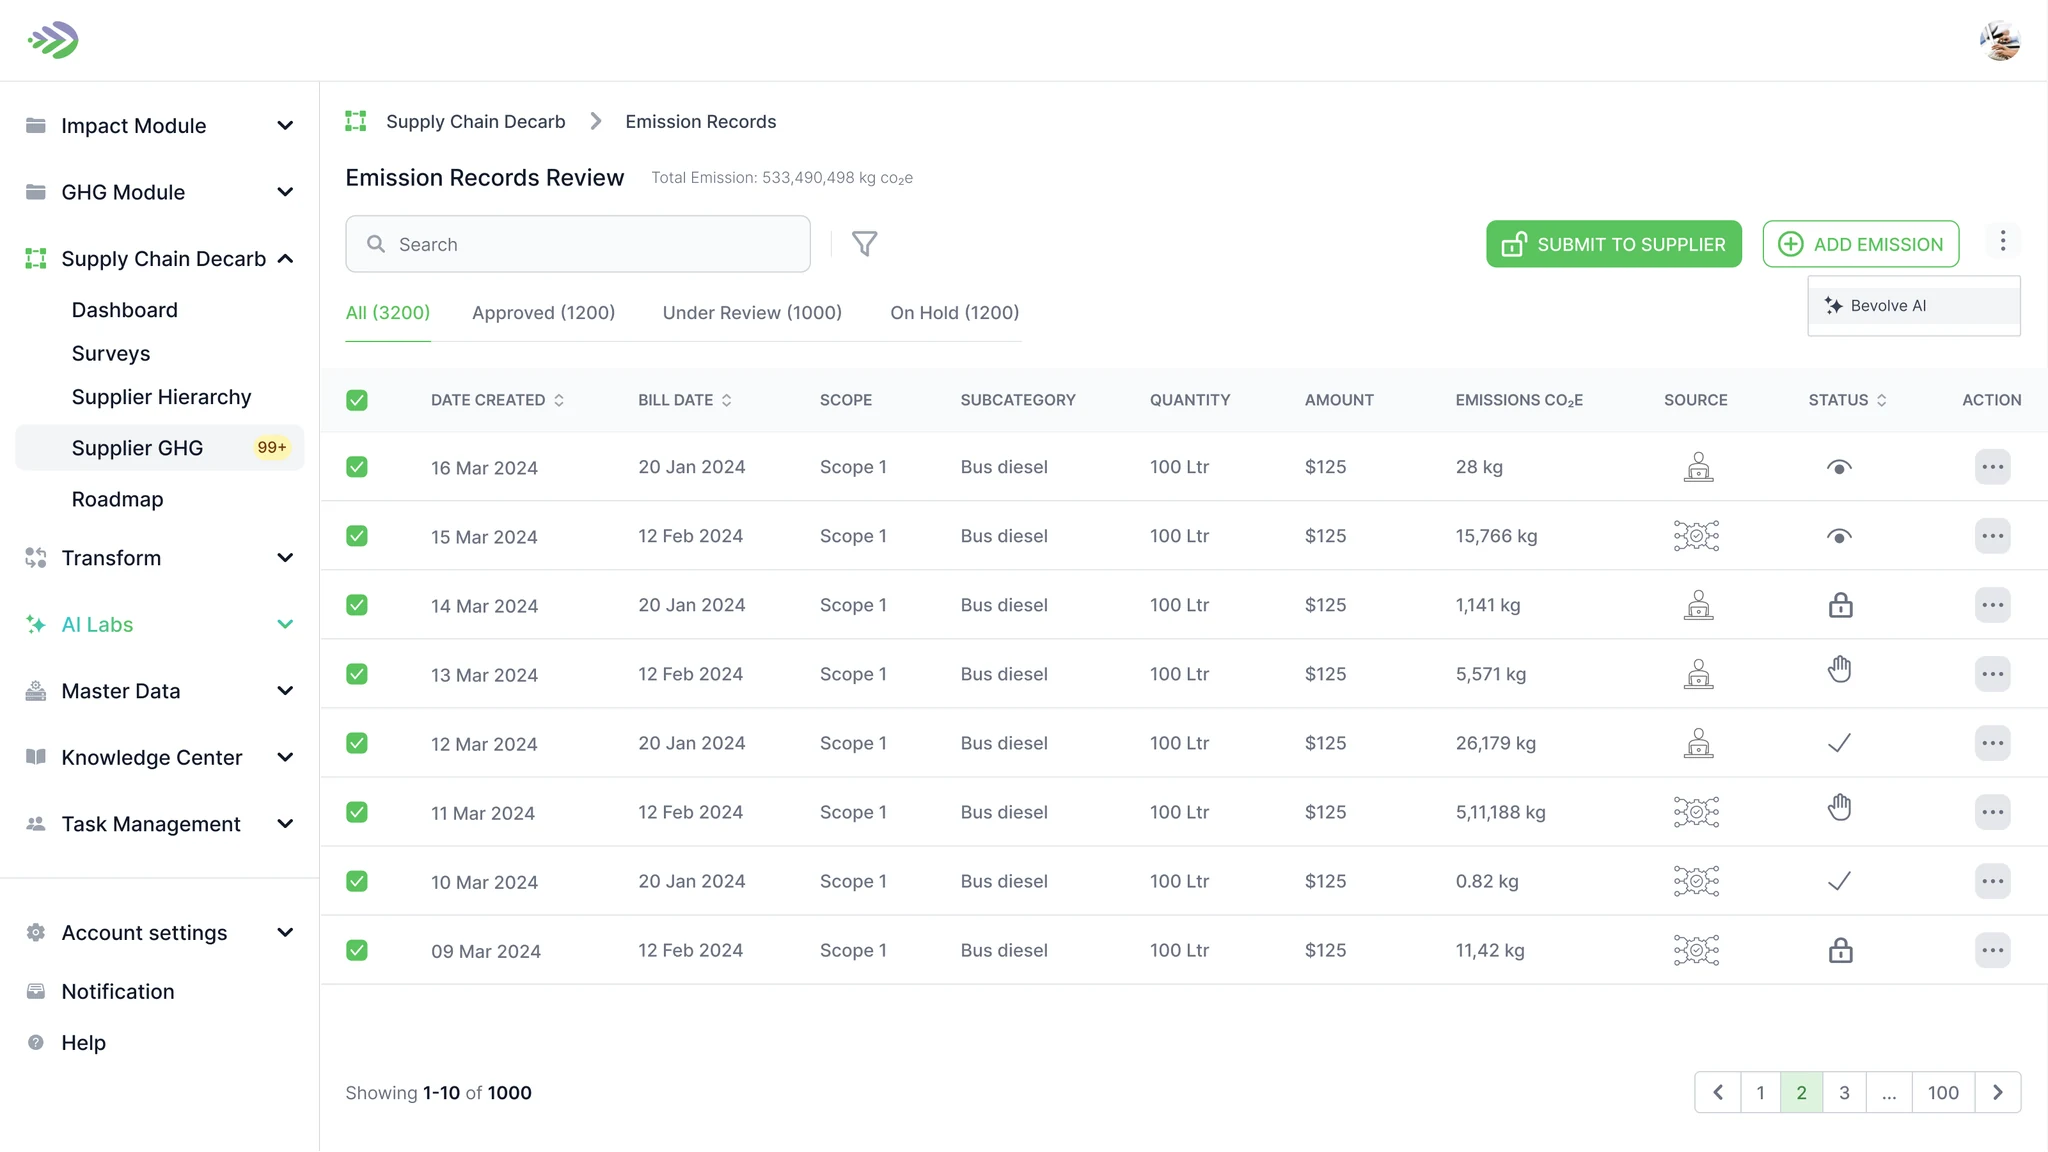
The screens follow the flow in order: the OEM onboards and adds suppliers, the supply chain takes shape as a hierarchy, a survey is chosen, previewed, and assigned, the supplier enters and submits its emissions, and the OEM sees the result on its supplier dashboard.
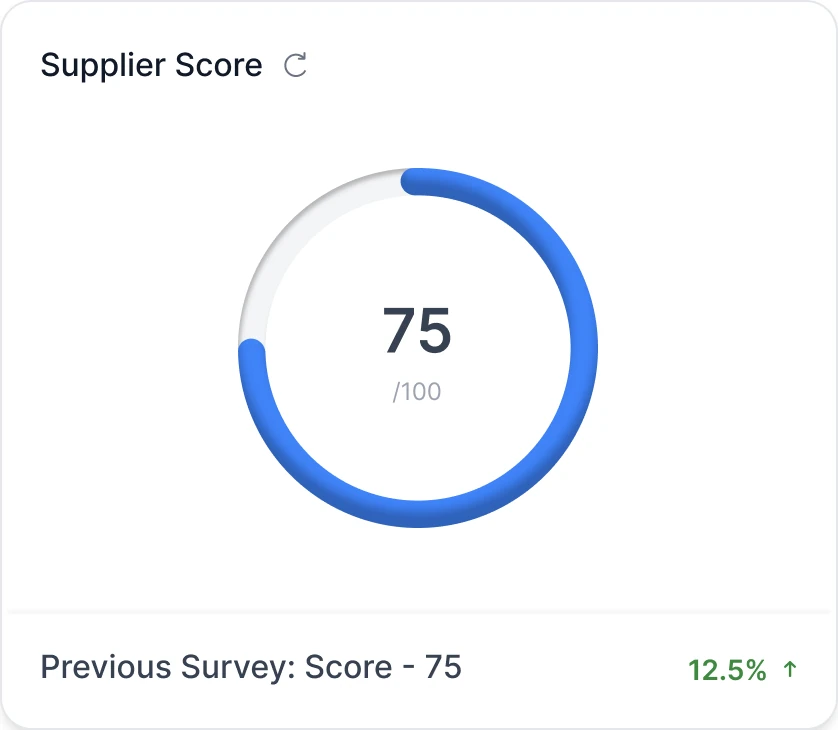
Each supplier's survey response is scored out of 100 and compared with its previous survey.
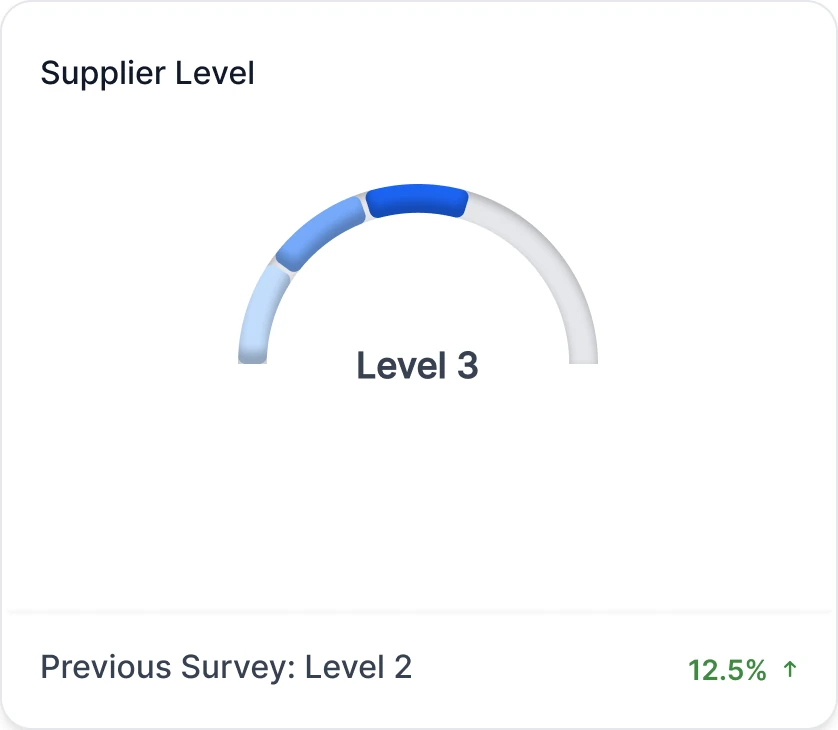
The score maps to a maturity level, so progress reads at a glance.
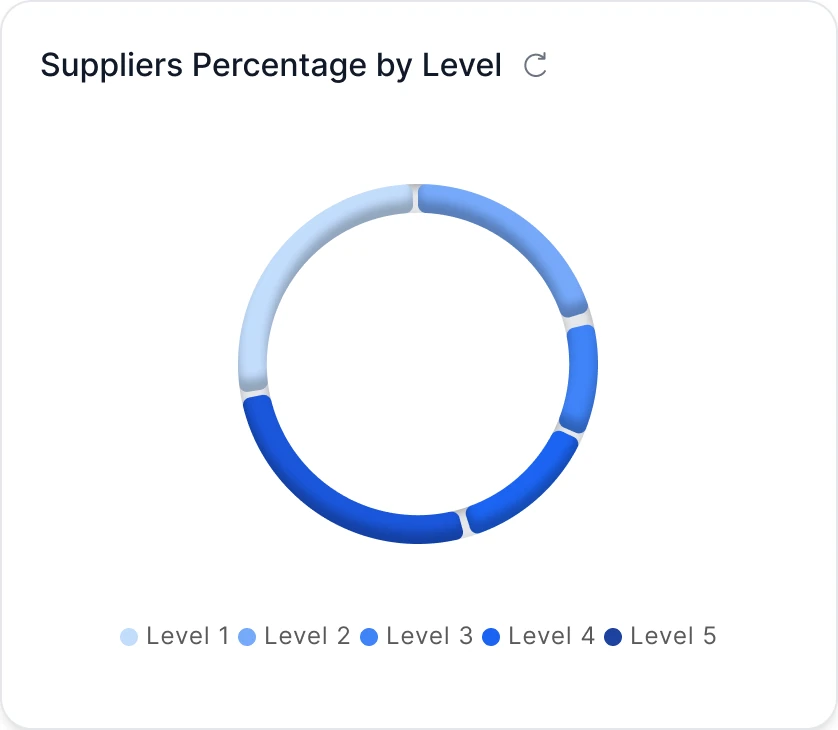
How the whole supplier base spreads across levels 1 to 5.
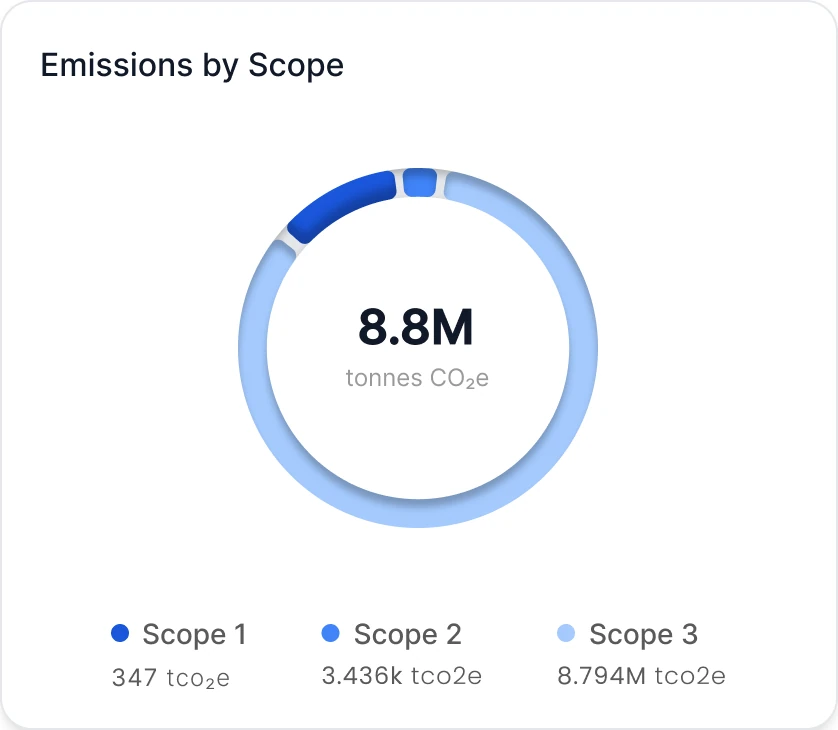
A supplier's Scope 1, 2, and 3 emissions, the numbers that land in the OEM's Scope 3.
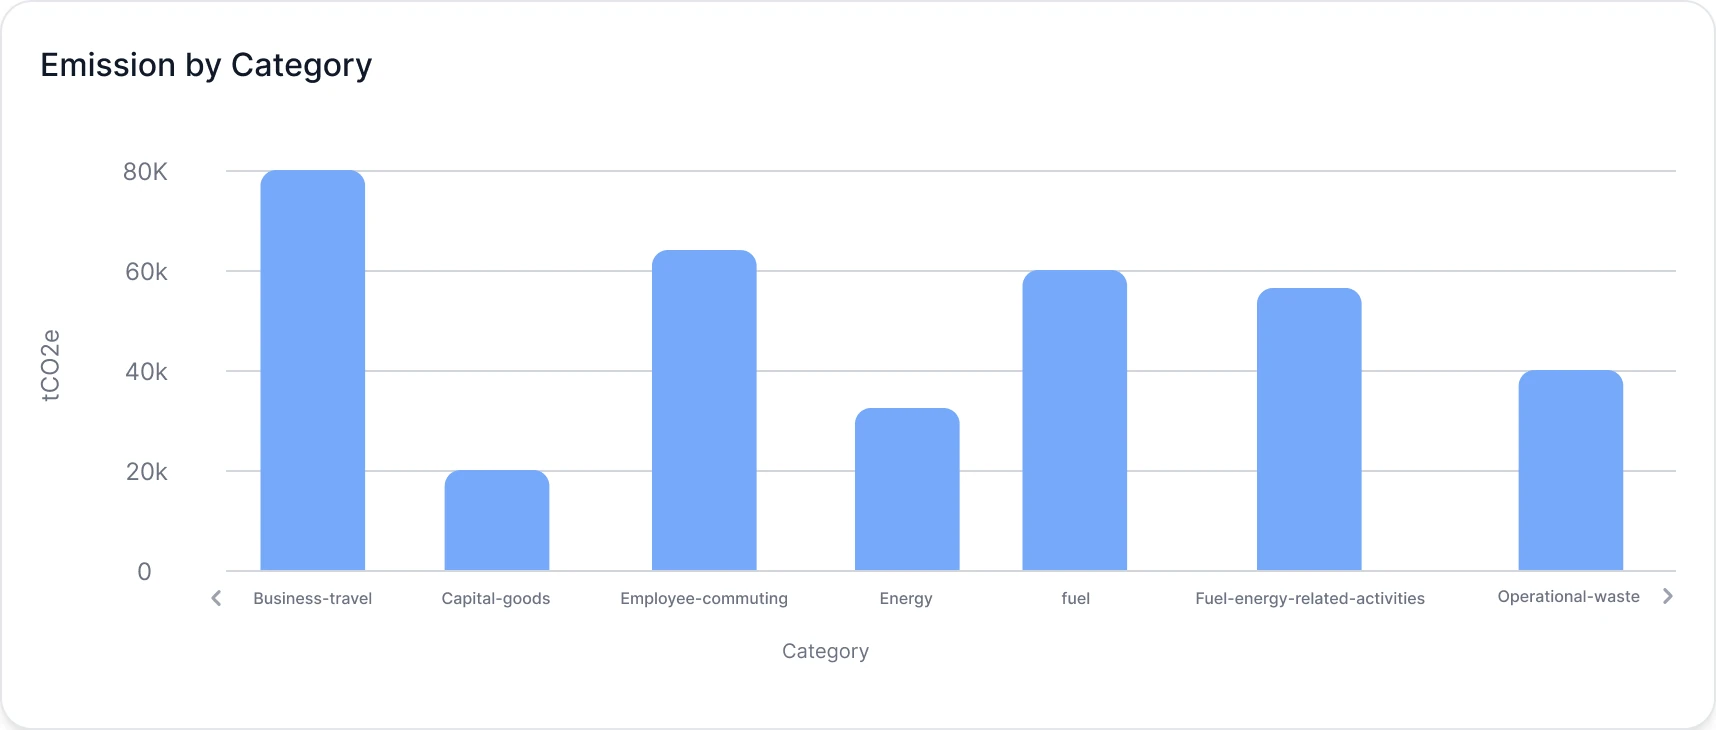
Where those emissions come from, by Scope 3 category: business travel, capital goods, commuting, energy, fuel, and more.
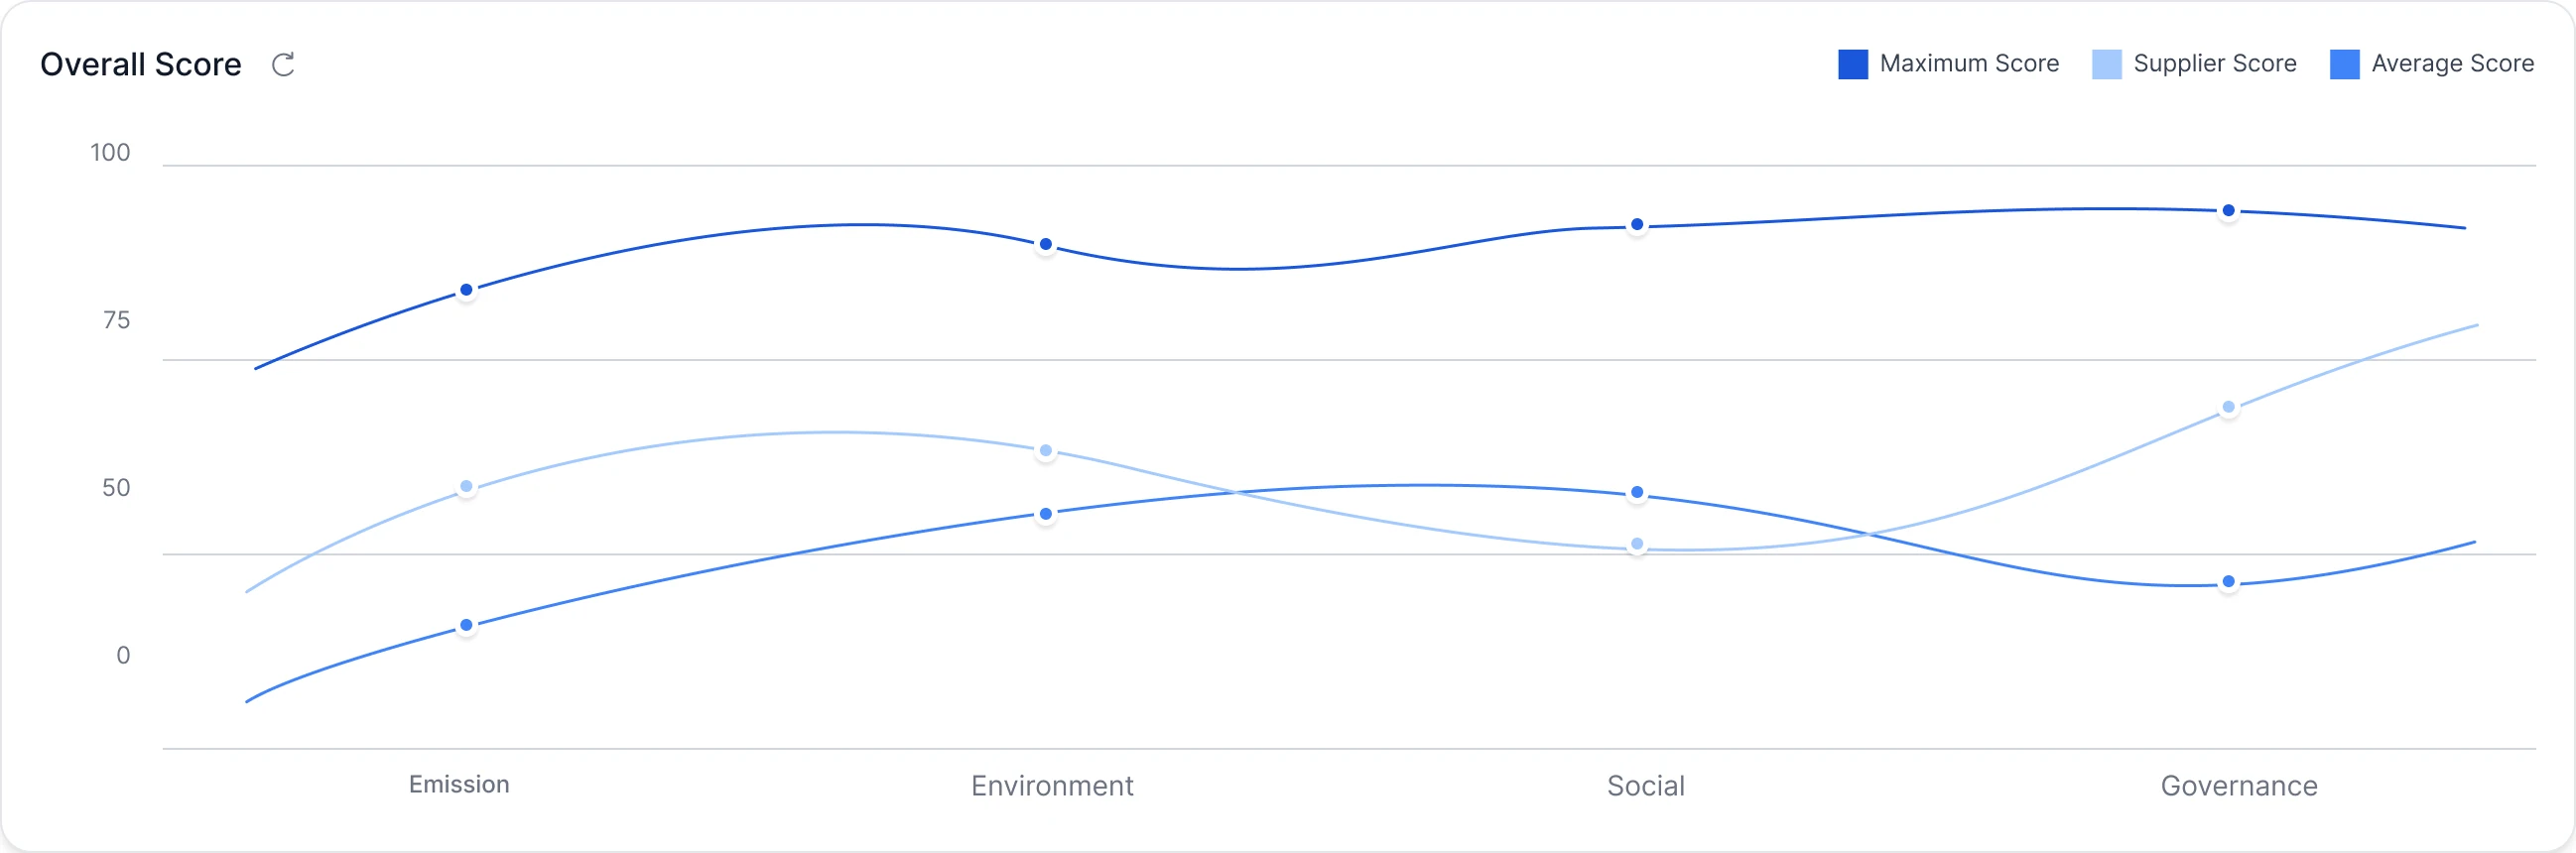
Emission, environment, social, and governance scores against the maximum and the average across suppliers.
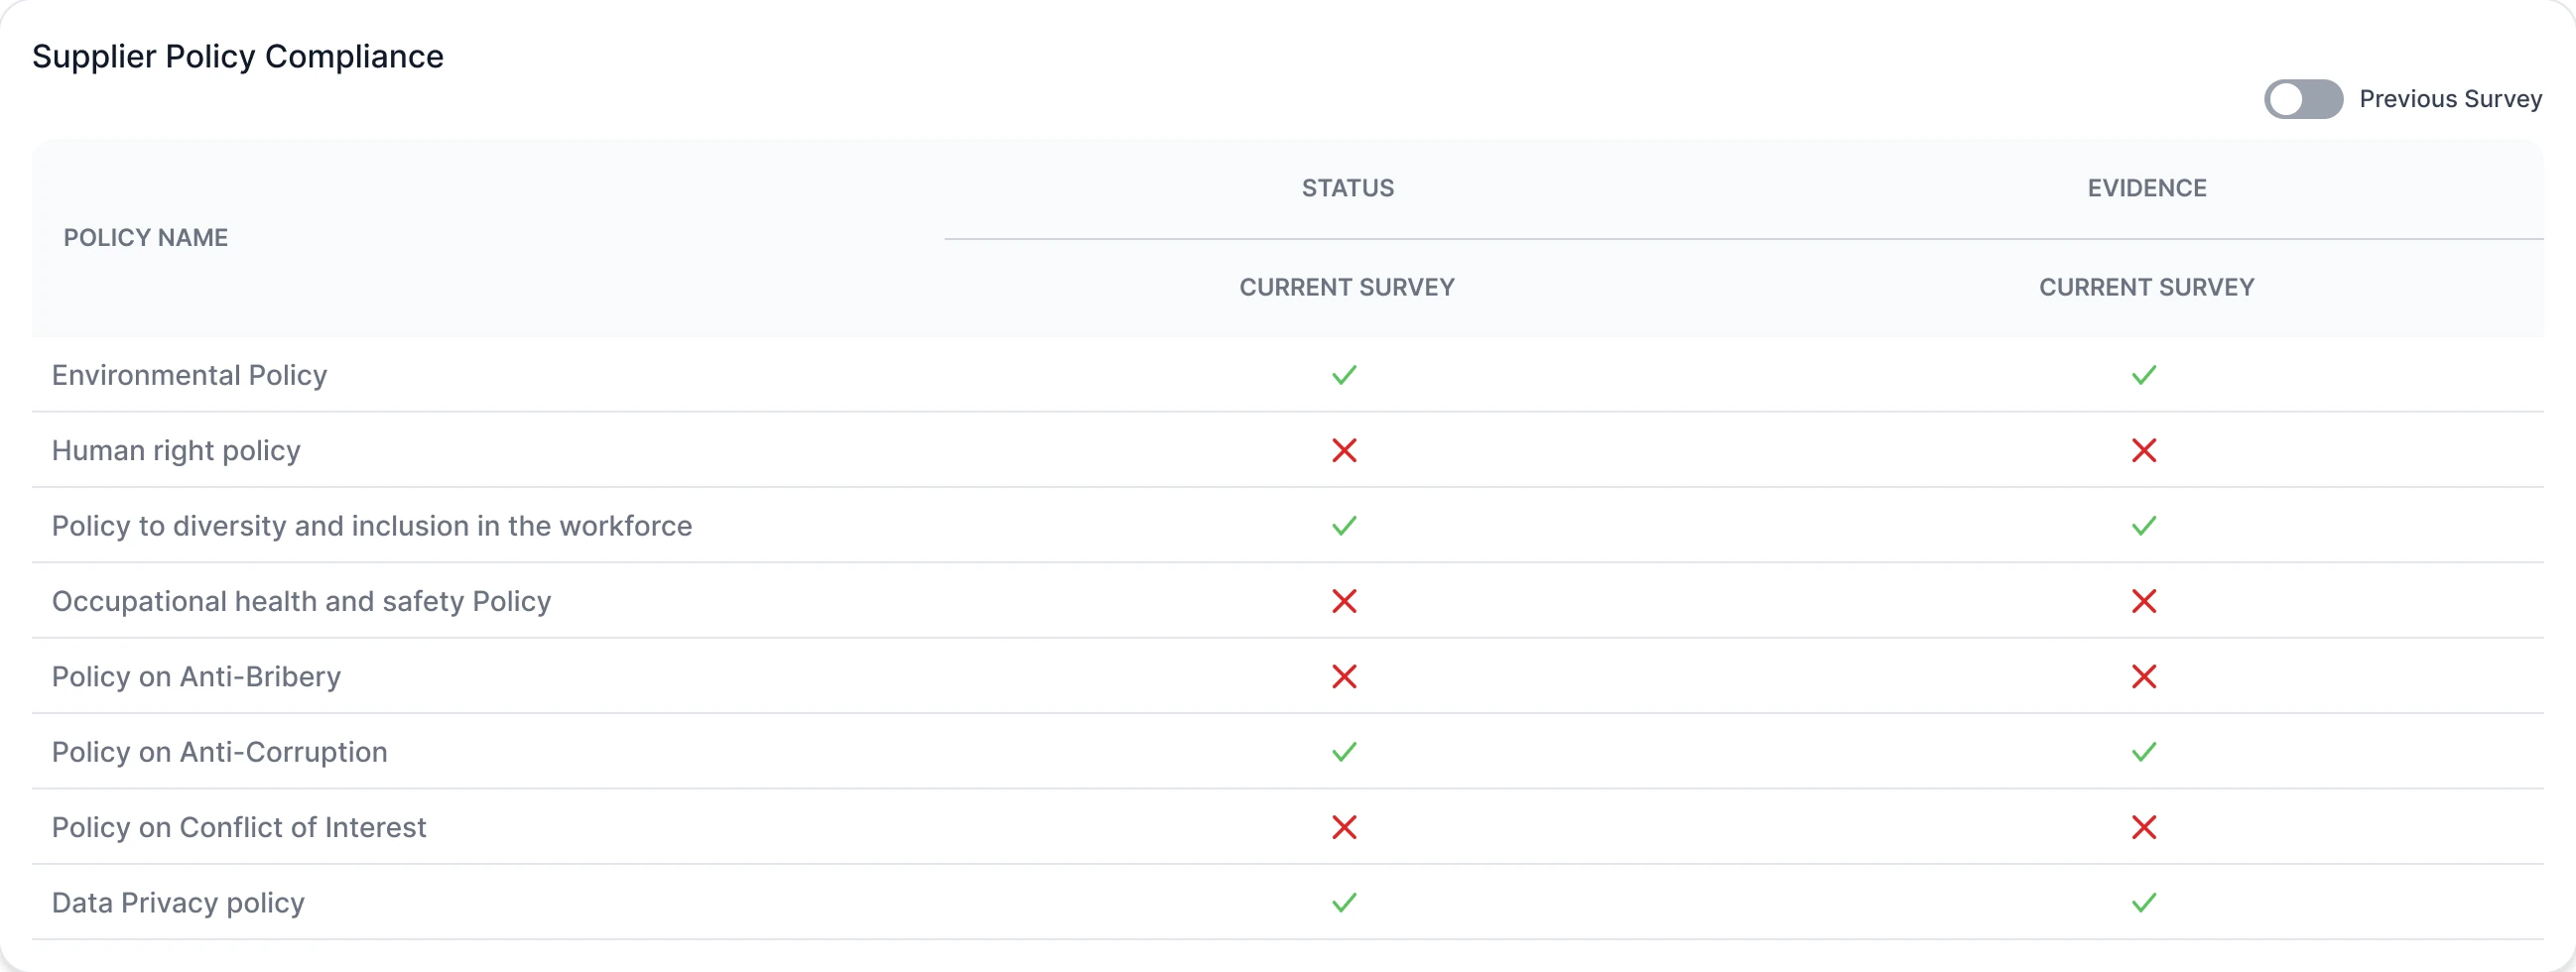
Which ESG policies a supplier has in place, with evidence, current survey against previous.
The Supplier module is live inside the Bevolve platform. OEMs onboard their suppliers, map the chain across tiers, send surveys and see every response scored on one dashboard. It gave Bevolve a Scope 3 story to take to OEM clients.
Designing for someone who opens your product twice a year is a different job. Every supplier screen had to work without training, so plain words and short sections mattered more than any visual detail.
Show the OEM which tier-2 and tier-3 suppliers are still pending, so the follow-up happens inside the product instead of over email.